Olivia attends school at the University of Alberta and decides to compile a contingency table of students who are taking various degrees. She surveys a group of students, and the data she collects is listed in the contingency table below. Olivia want to see if degree and gender are dependent variables. PhD Masters Undergraduate Male 18 20 73 Female 12 30 70 (a) In performing this statistical test, state the hypotheses. O Họ: Degree and gender are independent vs. H4: Degree and gender are dependent O Họ: Degree and gender are dependent vs. H4: Degree and gender are independent O Ho: Degree is associated with gender vs. HA: Degree is not associated with gender O Ho: The proportion of female students is the same as the proportion of male students vs. HA: The proportion of female students is not the same as the proportion of male students O Ho: Degree is related to gender vs. Ha: Degree is not related to gender (b) What is the expected frequencies of each cell? Fill out the table. (Round your answers to 2 decimal places, if needed.) PhD Masters Undergraduate Male 14.93 Female 71.82 (c) What is the test statistic value for this hypothesis test? (Round your answers to 2 decimal places, if needed.) TS = (d) The test statistic follows a chi-square distribution with df = 6
Olivia attends school at the University of Alberta and decides to compile a contingency table of students who are taking various degrees. She surveys a group of students, and the data she collects is listed in the contingency table below. Olivia want to see if degree and gender are dependent variables. PhD Masters Undergraduate Male 18 20 73 Female 12 30 70 (a) In performing this statistical test, state the hypotheses. O Họ: Degree and gender are independent vs. H4: Degree and gender are dependent O Họ: Degree and gender are dependent vs. H4: Degree and gender are independent O Ho: Degree is associated with gender vs. HA: Degree is not associated with gender O Ho: The proportion of female students is the same as the proportion of male students vs. HA: The proportion of female students is not the same as the proportion of male students O Ho: Degree is related to gender vs. Ha: Degree is not related to gender (b) What is the expected frequencies of each cell? Fill out the table. (Round your answers to 2 decimal places, if needed.) PhD Masters Undergraduate Male 14.93 Female 71.82 (c) What is the test statistic value for this hypothesis test? (Round your answers to 2 decimal places, if needed.) TS = (d) The test statistic follows a chi-square distribution with df = 6

Glencoe Algebra 1, Student Edition, 9780079039897, 0079039898, 2018
18th Edition
ISBN:9780079039897
Author:Carter
Publisher:Carter
Chapter10: Statistics
Section10.6: Summarizing Categorical Data
Problem 25PPS

Related questions
Question
100%
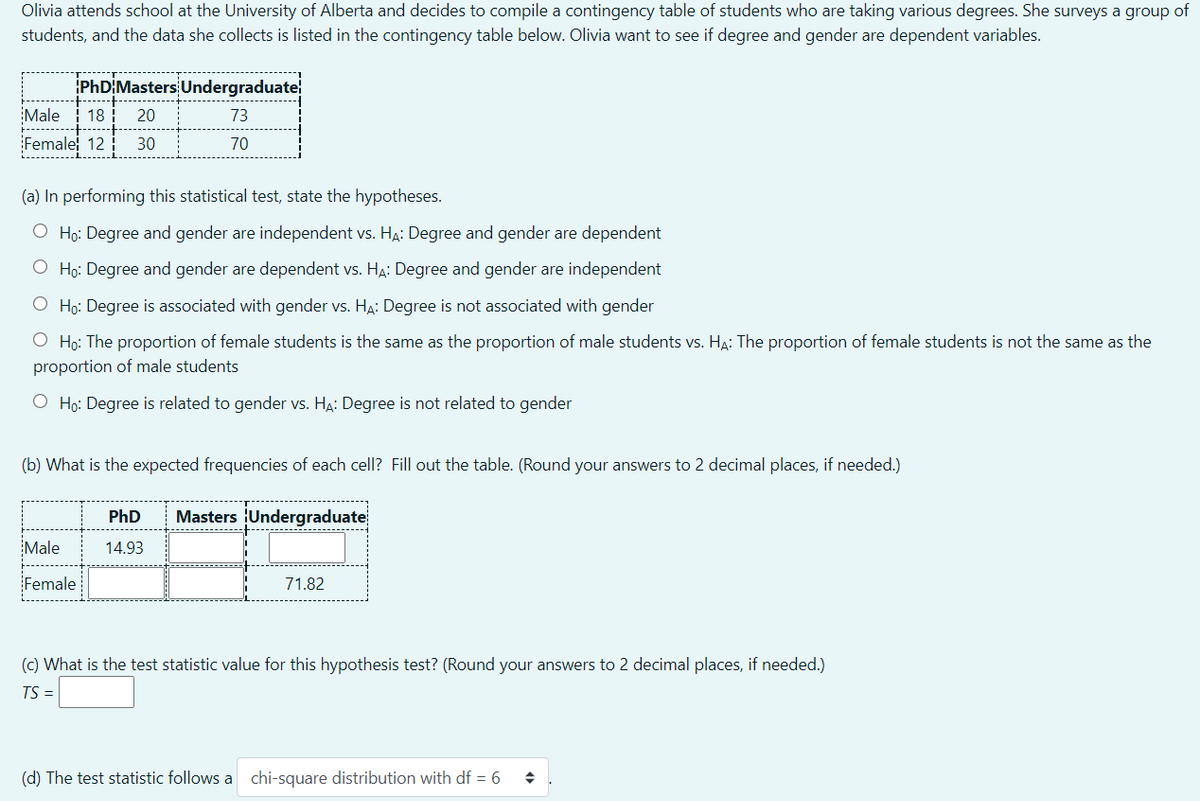
Transcribed Image Text:Olivia attends school at the University of Alberta and decides to compile a contingency table of students who are taking various degrees. She surveys a group of
students, and the data she collects is listed in the contingency table below. Olivia want to see if degree and gender are dependent variables.
iPhDİMasters Undergraduate
Male
18
20
73
Female 12
30
70
(a) In performing this statistical test, state the hypotheses.
O Họ: Degree and gender are independent vs. H4: Degree and gender are dependent
O Ho: Degree and gender are dependent vs. HA: Degree and gender are independent
O Ho: Degree is associated with gender vs. HA: Degree is not associated with gender
O Họ: The proportion of female students is the same as the proportion of male students vs. HA: The proportion of female students is not the same as the
proportion of male students
O Ho: Degree is related to gender vs. HA: Degree is not related to gender
(b) What is the expected frequencies of each cell? Fill out the table. (Round your answers to 2 decimal places, if needed.)
PhD
Masters Undergraduate
Male
14.93
Female
71.82
(c) What is the test statistic value for this hypothesis test? (Round your answers to 2 decimal places, if needed.)
TS =
(d) The test statistic follows a chi-square distribution with df = 6
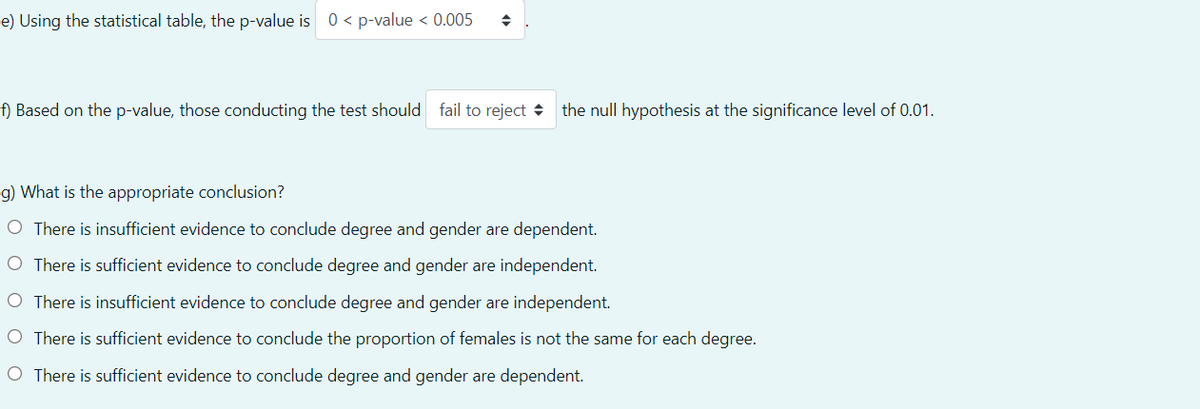
Transcribed Image Text:e) Using the statistical table, the p-value is 0 < p-value < 0.005
f) Based on the p-value, those conducting the test should fail to reject + the null hypothesis at the significance level of 0.01.
g) What is the appropriate conclusion?
O There is insufficient evidence to conclude degree and gender are dependent.
O There is sufficient evidence to conclude degree and gender are independent.
O There is insufficient evidence to conclude degree and gender are independent.
O There is sufficient evidence to conclude the proportion of females is not the same for each degree.
O There is sufficient evidence to conclude degree and gender are dependent.
Expert Solution
This question has been solved!
Explore an expertly crafted, step-by-step solution for a thorough understanding of key concepts.

Step by step
Solved in 8 steps with 3 images

Recommended textbooks for you
Glencoe Algebra 1, Student Edition, 9780079039897…
Algebra
ISBN:
9780079039897
Author:
Carter
Publisher:
McGraw Hill

College Algebra (MindTap Course List)
Algebra
ISBN:
9781305652231
Author:
R. David Gustafson, Jeff Hughes
Publisher:
Cengage Learning
Glencoe Algebra 1, Student Edition, 9780079039897…
Algebra
ISBN:
9780079039897
Author:
Carter
Publisher:
McGraw Hill
College Algebra (MindTap Course List)
Algebra
ISBN:
9781305652231
Author:
R. David Gustafson, Jeff Hughes
Publisher:
Cengage Learning