ollowing are the 2010 obesity rates by U.S. states and Washington, DC. State Percent (%) State Percent (%) State Percent (%) Alabama 32.2 Kentucky 31.3 North Dakota 27.2 Alaska 24.5 Louisiana 31.0 Ohio 29.2 Arizona 24.3 Maine 26.8 Oklahoma 30.4 Arkansas 30.1 Maryland 27.1 Oregon 26.8 California 24.0 Massachusetts 23.0 Pennsylvania 28.6 Colorado 21.0 Michigan 30.9 Rhode Island 25.5 Connecticut 22.5 Minnesota 24.8 South Carolina 31.5 Delaware 28.0 Mississippi 34.0 South Dakota 27.3 Washington, DC 22.2 Missouri 30.5 Tennessee 30.8 Florida 26.6 Montana 23.0 Техas 31.0 Georgia 29.6 Nebraska 26.9 Utah 22.5 Hawaii 22.7 Nevada 22.4 Vermont 23.2 Idaho 26.5 New Hampshire 25.0 Virginia 26.0 Illinois 28.2 New Jersey 23.8 Washington 25.5 Indiana 29.6 New Mexico 25.1 West Virginia 32.5 lowa 28.4 New York 23.9 Wisconsin 26.3 Kansas 29.4 North Carolina 27.8 Wyoming 25.1
ollowing are the 2010 obesity rates by U.S. states and Washington, DC. State Percent (%) State Percent (%) State Percent (%) Alabama 32.2 Kentucky 31.3 North Dakota 27.2 Alaska 24.5 Louisiana 31.0 Ohio 29.2 Arizona 24.3 Maine 26.8 Oklahoma 30.4 Arkansas 30.1 Maryland 27.1 Oregon 26.8 California 24.0 Massachusetts 23.0 Pennsylvania 28.6 Colorado 21.0 Michigan 30.9 Rhode Island 25.5 Connecticut 22.5 Minnesota 24.8 South Carolina 31.5 Delaware 28.0 Mississippi 34.0 South Dakota 27.3 Washington, DC 22.2 Missouri 30.5 Tennessee 30.8 Florida 26.6 Montana 23.0 Техas 31.0 Georgia 29.6 Nebraska 26.9 Utah 22.5 Hawaii 22.7 Nevada 22.4 Vermont 23.2 Idaho 26.5 New Hampshire 25.0 Virginia 26.0 Illinois 28.2 New Jersey 23.8 Washington 25.5 Indiana 29.6 New Mexico 25.1 West Virginia 32.5 lowa 28.4 New York 23.9 Wisconsin 26.3 Kansas 29.4 North Carolina 27.8 Wyoming 25.1

Holt Mcdougal Larson Pre-algebra: Student Edition 2012
1st Edition
ISBN:9780547587776
Author:HOLT MCDOUGAL
Publisher:HOLT MCDOUGAL
Chapter11: Data Analysis And Probability
Section11.5: Interpreting Data
Problem 1C

Related questions

Topic Video
Question
100%
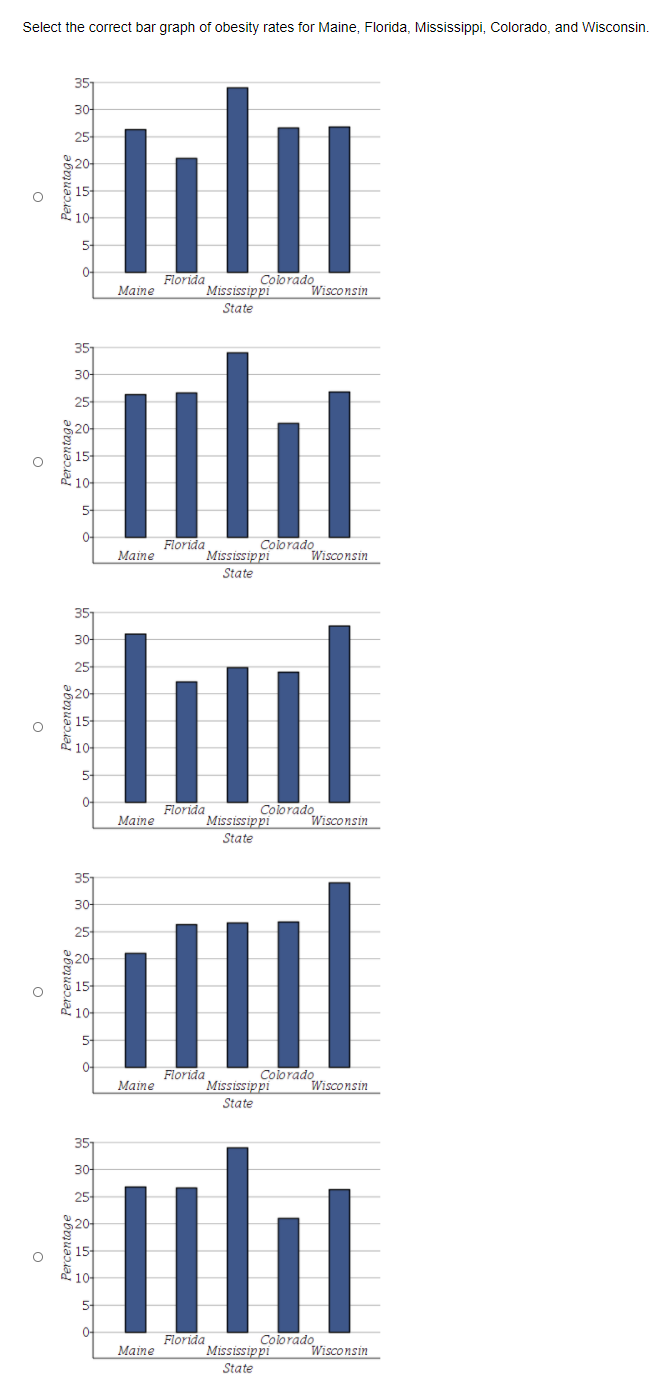
Transcribed Image Text:Select the correct bar graph of obesity rates for Maine, Florida, Mississippi, Colorado, and Wisconsin.
State
Percentage
Percentage
Percentage
Percentage
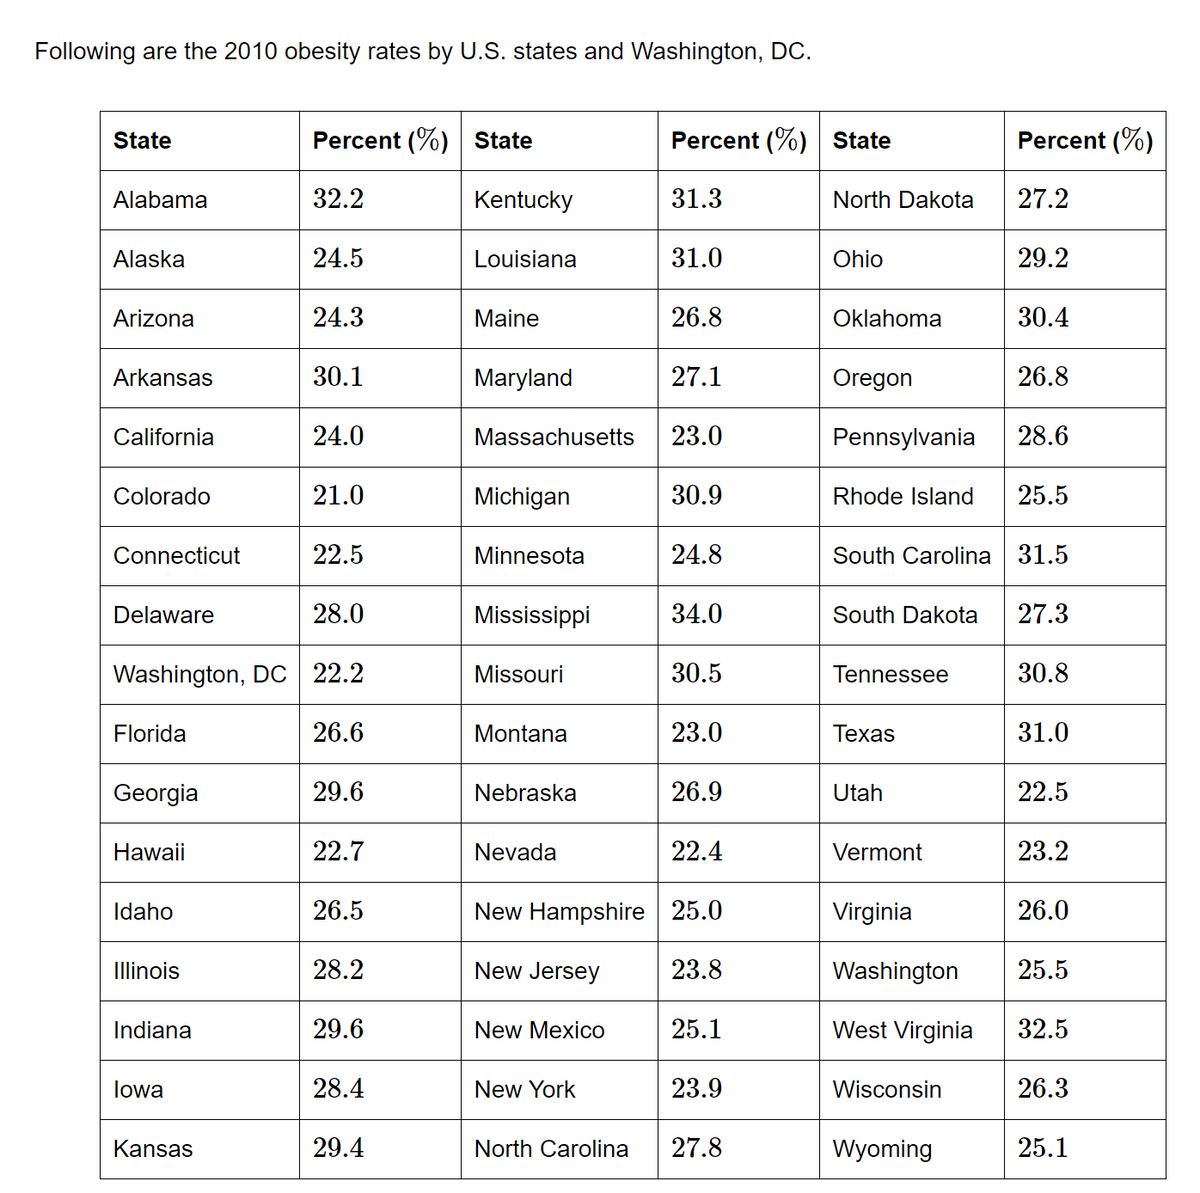
Transcribed Image Text:Following are the 2010 obesity rates by U.S. states and Washington, DC.
State
Percent (%) State
Percent (%) State
Percent (%)
Alabama
32.2
Kentucky
31.3
North Dakota
27.2
Alaska
24.5
Louisiana
31.0
Ohio
29.2
Arizona
24.3
Maine
26.8
Oklahoma
30.4
Arkansas
30.1
Maryland
27.1
Oregon
26.8
California
24.0
Massachusetts
23.0
Pennsylvania
28.6
Colorado
21.0
Michigan
30.9
Rhode Island
25.5
Connecticut
22.5
Minnesota
24.8
South Carolina 31.5
Delaware
28.0
Mississippi
34.0
South Dakota
27.3
Washington, DC 22.2
Missouri
30.5
Tennessee
30.8
Florida
26.6
Montana
23.0
Техas
31.0
Georgia
29.6
Nebraska
26.9
Utah
22.5
Hawaii
22.7
Nevada
22.4
Vermont
23.2
Idaho
26.5
New Hampshire 25.0
Virginia
26.0
Illinois
28.2
New Jersey
23.8
Washington
25.5
Indiana
29.6
New Mexico
25.1
West Virginia
32.5
lowa
28.4
New York
23.9
Wisconsin
26.3
Kansas
29.4
North Carolina
27.8
Wyoming
25.1
Expert Solution
This question has been solved!
Explore an expertly crafted, step-by-step solution for a thorough understanding of key concepts.

This is a popular solution!

Trending now
This is a popular solution!

Step by step
Solved in 2 steps with 2 images

Knowledge Booster


Learn more about
Need a deep-dive on the concept behind this application? Look no further. Learn more about this topic, algebra and related others by exploring similar questions and additional content below.Recommended textbooks for you
Holt Mcdougal Larson Pre-algebra: Student Edition…
Algebra
ISBN:
9780547587776
Author:
HOLT MCDOUGAL
Publisher:
HOLT MCDOUGAL
Holt Mcdougal Larson Pre-algebra: Student Edition…
Algebra
ISBN:
9780547587776
Author:
HOLT MCDOUGAL
Publisher:
HOLT MCDOUGAL