The Nielsen Home Technology Report provided information about home technology and its usage. The following data are the hours of personal computer usage during one week for a sample of 50 persons. 4.1 1.5 10.4 5.9 3.4 5.7 1,6 3.9 6.1 3.0 3.7 3.1 4.8 2.0 14.8 5.4 4.2 4.1 11.1 3.5 4.1 4.1 8.8 5.6 4.3 3.3 7.1 10.3 6.2 7.6 10.8 2.8 9.5 12.9 12.1 0.7 4.0 9.2 4.4 5.7 7.2 6.1 5.7 5.9 4.7 3.9 3.7 3.1 6.1 3.1 Summarize the data by constructing the following: A frequency distribution (use a class width of three hours) b. A relative frequency distribution A histogram a. с.
The Nielsen Home Technology Report provided information about home technology and its usage. The following data are the hours of personal computer usage during one week for a sample of 50 persons. 4.1 1.5 10.4 5.9 3.4 5.7 1,6 3.9 6.1 3.0 3.7 3.1 4.8 2.0 14.8 5.4 4.2 4.1 11.1 3.5 4.1 4.1 8.8 5.6 4.3 3.3 7.1 10.3 6.2 7.6 10.8 2.8 9.5 12.9 12.1 0.7 4.0 9.2 4.4 5.7 7.2 6.1 5.7 5.9 4.7 3.9 3.7 3.1 6.1 3.1 Summarize the data by constructing the following: A frequency distribution (use a class width of three hours) b. A relative frequency distribution A histogram a. с.

Glencoe Algebra 1, Student Edition, 9780079039897, 0079039898, 2018
18th Edition
ISBN:9780079039897
Author:Carter
Publisher:Carter
Chapter10: Statistics
Section10.6: Summarizing Categorical Data
Problem 4BGP

Related questions
Question
Transcribed Image Text:about the off-course income of these 50 professional golfers?
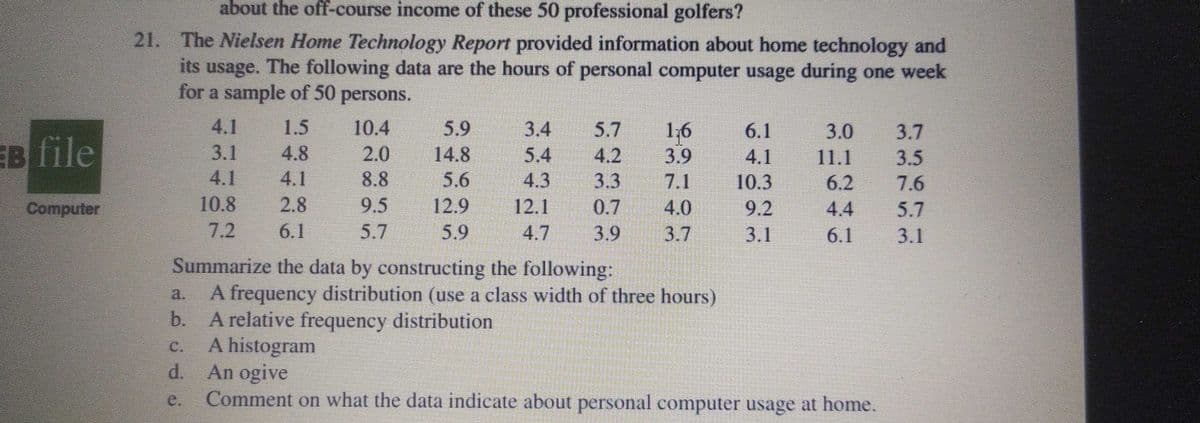
21. The Nielsen Home Technology Report provided information about home technology and
its usage. The following data are the hours of personal computer usage during one week
for a sample of 50 persons.
4.1
3.1
4.1
10.8
7.2
1.5
10.4
2.0
5.9
14.8
5.6
12.9
3.4
5.7
1,6
6.1
3.0
3.7
EB file
4.8
5.4
4.2
3.9
4.1
3.5
7.6
11.1
4.1
2.8
6.1
8.8
4.3
3.3
6.2
4.4
6.1
7.1
10.3
9.5
12.1
0.7
3.9
Computer
4.0
9.2
5.7
5.7
5.9
4.7
3.7
3.1
3.1
Summarize the data by constructing the following:
A frequency distribution (use a class width of three hours)
b. A relative frequency distribution
A histogram
d. An ogive
Comment on what the data indicate about personal computer usage at home.
C.
e.
Expert Solution
This question has been solved!
Explore an expertly crafted, step-by-step solution for a thorough understanding of key concepts.

This is a popular solution!

Trending now
This is a popular solution!

Step by step
Solved in 2 steps with 1 images

Recommended textbooks for you
Glencoe Algebra 1, Student Edition, 9780079039897…
Algebra
ISBN:
9780079039897
Author:
Carter
Publisher:
McGraw Hill
Glencoe Algebra 1, Student Edition, 9780079039897…
Algebra
ISBN:
9780079039897
Author:
Carter
Publisher:
McGraw Hill