On average, Americans have lived in 2 places by the time they are 18 years old. Is this average less for college students? The 67 randomly selected college students who answered the survey question had lived in an average of 1.99 places by the time they were 18 years old. The standard deviation for the survey group was 0.3. What can be concluded at the a = 0.10 level of significance? a. For this study, we should use t-test for a population mean b. The null and alternative hypotheses would be: Ho: P 2 Hị: 2 c. The test statistic t v = (please show your answer to 3 decimal places.) -0.273 d. The p-value = 0.3929 e. The p-value is >V a f. Based on this, we should fail to reject g. Thus, the final conclusion is that .. (Please show your answer to 4 decimal places.) ] the null hypothesis. The data suggest that the populaton mean is significantly less than 2 at a = 0.10, so there is statistically significant evidence to conclude that the population mean number of places that college students lived in by the time they were 18 years old is less than 2. O The data suggest that the sample mean is not significantly less than 2 at a = 0.10, so there is statistically insignificant evidence to conclude that the sample mean number of places that college students lived in by the time they were 18 years old is less than 1.99. O The data suggest that the population mean is not significantly less than 2 at a = 0.10, so there is statistically insignificant evidence to conclude that the population mean number of places that college students lived in by the time they were 18 years old is less than 2. h. Interpret the p-value in the context of the study. Olf the population mean number of places that college students lived in by the time they were 18 years old is 2 and if you survey another 67 college students, then there would be a 39.29120944% chance that the sample mean for these 67 college students would be less than 1.99.
On average, Americans have lived in 2 places by the time they are 18 years old. Is this average less for college students? The 67 randomly selected college students who answered the survey question had lived in an average of 1.99 places by the time they were 18 years old. The standard deviation for the survey group was 0.3. What can be concluded at the a = 0.10 level of significance? a. For this study, we should use t-test for a population mean b. The null and alternative hypotheses would be: Ho: P 2 Hị: 2 c. The test statistic t v = (please show your answer to 3 decimal places.) -0.273 d. The p-value = 0.3929 e. The p-value is >V a f. Based on this, we should fail to reject g. Thus, the final conclusion is that .. (Please show your answer to 4 decimal places.) ] the null hypothesis. The data suggest that the populaton mean is significantly less than 2 at a = 0.10, so there is statistically significant evidence to conclude that the population mean number of places that college students lived in by the time they were 18 years old is less than 2. O The data suggest that the sample mean is not significantly less than 2 at a = 0.10, so there is statistically insignificant evidence to conclude that the sample mean number of places that college students lived in by the time they were 18 years old is less than 1.99. O The data suggest that the population mean is not significantly less than 2 at a = 0.10, so there is statistically insignificant evidence to conclude that the population mean number of places that college students lived in by the time they were 18 years old is less than 2. h. Interpret the p-value in the context of the study. Olf the population mean number of places that college students lived in by the time they were 18 years old is 2 and if you survey another 67 college students, then there would be a 39.29120944% chance that the sample mean for these 67 college students would be less than 1.99.

MATLAB: An Introduction with Applications
6th Edition
ISBN:9781119256830
Author:Amos Gilat
Publisher:Amos Gilat
Chapter1: Starting With Matlab
Section: Chapter Questions
Problem 1P

Related questions

Concept explainers
Equations and Inequations
Equations and inequalities describe the relationship between two mathematical expressions.
Linear Functions
A linear function can just be a constant, or it can be the constant multiplied with the variable like x or y. If the variables are of the form, x2, x1/2 or y2 it is not linear. The exponent over the variables should always be 1.
Question
Only answers G-I
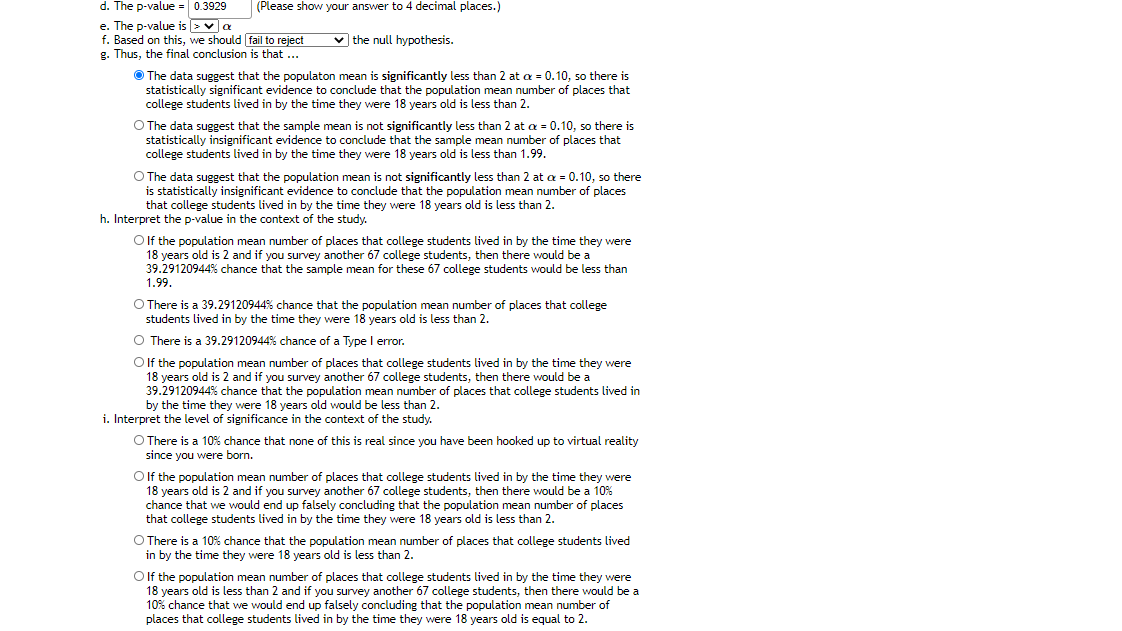
Transcribed Image Text:d. The p-value = 0.3929
e. The p-value is >va
f. Based on this, we should fail to reject
g. Thus, the final conclusion is that ...
(Please show your answer to 4 decimal places.)
v the null hypothesis.
O The data suggest that the populaton mean is significantly less than 2 at a = 0.10, so there is
statistically significant evidence to conclude that the population mean number of places that
college students lived in by the time they were 18 years old is less than 2.
O The data suggest that the sample mean is not significantly less than 2 at a = 0.10, so there is
statistically insignificant evidence to conclude that the sample mean number of places that
college students lived in by the time they were 18 years old is less than 1.99.
O The data suggest that the population mean is not significantly less than 2 at a = 0.10, so there
is statistically insignificant evidence to conclude that the population mean number of places
that college students lived in by the time they were 18 years old is less than 2.
h. Interpret the p-value in the context of the study.
O lf the population mean number of places that college students lived in by the time they were
18 years old is 2 and if you survey another 67 college students, then there would be a
39.29120944% chance that the sample mean for these 67 college students would be less than
1.99.
O There is a 39.29120944% chance that the population mean number of places that college
students lived in by the time they were 18 years old is less than 2.
O There is a 39.29120944% chance of a Type I error.
Olf the population mean number of places that college students lived in by the time they were
18 years old is 2 and if you survey another 67 college students, then there would be a
39.29120944% chance that the population mean number of places that college students lived in
by the time they were 18 years old would be less than 2.
i. Interpret the level of significance in the context of the study.
O There is a 10% chance that none of this is real since you have been hooked up to virtual reality
since you were born.
Olf the population mean number of places that college students lived in by the time they were
18 years old is 2 and if you survey another 67 college students, then there would be a 10%
chance that we would end up falsely concluding that the population mean number of places
that college students lived in by the time they were 18 years old is less than 2.
O There is a 10% chance that the population mean number of places that college students lived
in by the time they were 18 years old is less than 2.
O lf the population mean number of places that college students lived in by the time they were
18 years old is less than 2 and if you survey another 67 college students, then there would be a
10% chance that we would end up falsely concluding that the population mean number of
places that college students lived in by the time they were 18 years old is equal to 2.
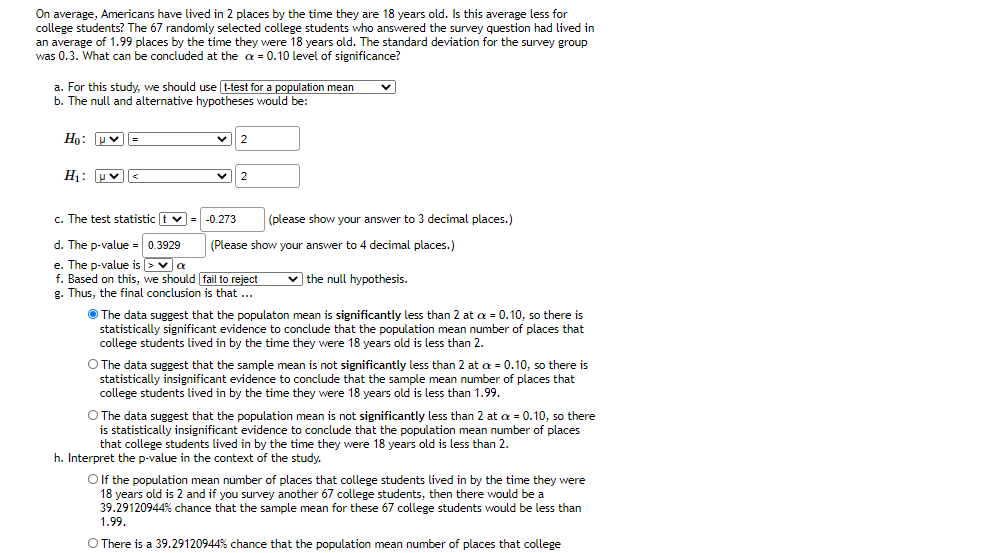
Transcribed Image Text:On average, Americans have lived in 2 places by the time they are 18 years old. Is this average less for
college students? The 67 randomly selected college students who answered the survey question had lived in
an average of 1.99 places by the time they were 18 years old. The standard deviation for the survey group
was 0.3. What can be concluded at the a = 0.10 level of significance?
a. For this study, we should use t-test for a population mean
b. The null and alternative hypotheses would be:
Ho: Pv=
H: Hv
2
c. The test statistic t v = -0.273
(please show your answer to 3 decimal places.)
d. The p-value = 0.3929
e. The p-value is >va
f. Based on this, we should fail to reject
g. Thus, the final conclusion is that ..
(Please show your answer to 4 decimal places.)
v the null hypothesis.
O The data suggest that the populaton mean is significantly less than 2 at a = 0.10, so there is
statistically significant evidence to conclude that the population mean number of places that
college students lived in by the time they were 18 years old is less than 2.
O The data suggest that the sample mean is not significantly less than 2 at a = 0.10, so there is
statistically insignificant evidence to conclude that the sample mean number of places that
college students lived in by the time they were 18 years old is less than 1.99.
O The data suggest that the population mean is not significantly less than 2 at a = 0.10, so there
is statistically insignificant evidence to conclude that the population mean number of places
that college students lived in by the time they were 18 years old is less than 2.
h. Interpret the p-value in the context of the study.
Olf the population mean number of places that college students lived in by the time they were
18 years old is 2 and if you survey another 67 college students, then there would be a
39.29120944% chance that the sample mean for these 67 college students would be less than
1.99.
O There is a 39.29120944% chance that the population mean number of places that college
Expert Solution
This question has been solved!
Explore an expertly crafted, step-by-step solution for a thorough understanding of key concepts.

This is a popular solution!

Trending now
This is a popular solution!

Step by step
Solved in 3 steps with 1 images

Knowledge Booster


Learn more about
Need a deep-dive on the concept behind this application? Look no further. Learn more about this topic, statistics and related others by exploring similar questions and additional content below.Recommended textbooks for you
MATLAB: An Introduction with Applications
Statistics
ISBN:
9781119256830
Author:
Amos Gilat
Publisher:
John Wiley & Sons Inc

Probability and Statistics for Engineering and th…
Statistics
ISBN:
9781305251809
Author:
Jay L. Devore
Publisher:
Cengage Learning

Statistics for The Behavioral Sciences (MindTap C…
Statistics
ISBN:
9781305504912
Author:
Frederick J Gravetter, Larry B. Wallnau
Publisher:
Cengage Learning
MATLAB: An Introduction with Applications
Statistics
ISBN:
9781119256830
Author:
Amos Gilat
Publisher:
John Wiley & Sons Inc
Probability and Statistics for Engineering and th…
Statistics
ISBN:
9781305251809
Author:
Jay L. Devore
Publisher:
Cengage Learning
Statistics for The Behavioral Sciences (MindTap C…
Statistics
ISBN:
9781305504912
Author:
Frederick J Gravetter, Larry B. Wallnau
Publisher:
Cengage Learning

Elementary Statistics: Picturing the World (7th E…
Statistics
ISBN:
9780134683416
Author:
Ron Larson, Betsy Farber
Publisher:
PEARSON

The Basic Practice of Statistics
Statistics
ISBN:
9781319042578
Author:
David S. Moore, William I. Notz, Michael A. Fligner
Publisher:
W. H. Freeman

Introduction to the Practice of Statistics
Statistics
ISBN:
9781319013387
Author:
David S. Moore, George P. McCabe, Bruce A. Craig
Publisher:
W. H. Freeman