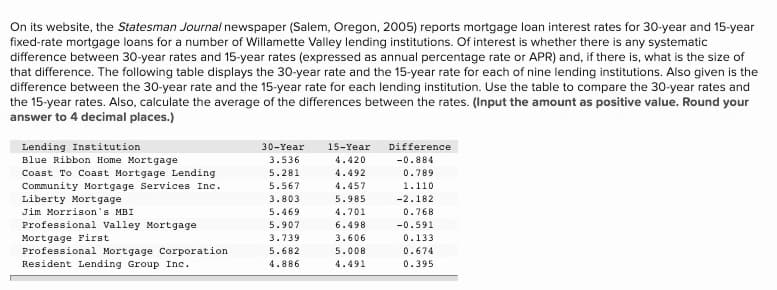
On its website, the Statesman Journal newspaper (Salem, Oregon, 2005) reports mortgage loan interest rates for 30-year and 15-year fixed-rate mortgage loans for a number of Willamette Valley lending institutions. Of interest is whether there is any systematic difference between 30-year rates and 15-year rates (expressed as annual percentage rate or APR) and, if there is, what is the size of that difference. The following table displays the 30-year rate and the 15-year rate for each of nine lending institutions. Also given is the difference between the 30-year rate and the 15-year rate for each lending institution. Use the table to compare the 30-year rates and the 15-year rates. Also, calculate the average of the differences between the rates. (Input the amount as positive value. Round your answer to 4 decimal places.) TIT Lending Institution 30-Year 15-Year Difference Blue Ribbon Home Mortgage 3.536 4.420 -0.884 Coast To Coast Mortgage Lending 5.281 4.492 0.789 Community Mortgage Services Inc. Liberty Mortgage 5.567 4.457 1.110 3.803 5.985 -2.182 Jim Morrison's MBI 5.469 4.701 0.768 Professional Valley Mortgage 5.907 6.498 -0.591 Mortgage First Professional Mortgage Corporation Resident Lending Group Inc. 3.739 3.606 0.133 5.682 5.008 0.674 4.886 4.491 0.395
On its website, the Statesman Journal newspaper (Salem, Oregon, 2005) reports mortgage loan interest rates for 30-year and 15-year fixed-rate mortgage loans for a number of Willamette Valley lending institutions. Of interest is whether there is any systematic difference between 30-year rates and 15-year rates (expressed as annual percentage rate or APR) and, if there is, what is the size of that difference. The following table displays the 30-year rate and the 15-year rate for each of nine lending institutions. Also given is the difference between the 30-year rate and the 15-year rate for each lending institution. Use the table to compare the 30-year rates and the 15-year rates. Also, calculate the average of the differences between the rates. (Input the amount as positive value. Round your answer to 4 decimal places.) TIT Lending Institution 30-Year 15-Year Difference Blue Ribbon Home Mortgage 3.536 4.420 -0.884 Coast To Coast Mortgage Lending 5.281 4.492 0.789 Community Mortgage Services Inc. Liberty Mortgage 5.567 4.457 1.110 3.803 5.985 -2.182 Jim Morrison's MBI 5.469 4.701 0.768 Professional Valley Mortgage 5.907 6.498 -0.591 Mortgage First Professional Mortgage Corporation Resident Lending Group Inc. 3.739 3.606 0.133 5.682 5.008 0.674 4.886 4.491 0.395

Chapter12: Sequences, Series And Binomial Theorem
Section12.3: Geometric Sequences And Series
Problem 12.58TI: What is the total effect on the economy of a government tax rebate of $500 to each household in...

Related questions

Concept explainers
Contingency Table
A contingency table can be defined as the visual representation of the relationship between two or more categorical variables that can be evaluated and registered. It is a categorical version of the scatterplot, which is used to investigate the linear relationship between two variables. A contingency table is indeed a type of frequency distribution table that displays two variables at the same time.
Binomial Distribution
Binomial is an algebraic expression of the sum or the difference of two terms. Before knowing about binomial distribution, we must know about the binomial theorem.
Topic Video
Question
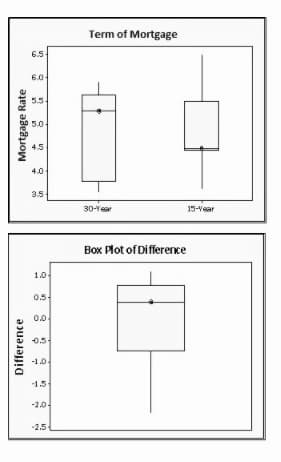
Transcribed Image Text:Term of Mortgage
6.5
6.0
55
5.0
4.5
4.0
3.5
30-Year
15-Vear
Box Plot of Difference
1.0
0.5
0.0
0.5
-1.0
-1.5
-2.0
-2.5
Difference
Mortgage Rate
Transcribed Image Text:On its website, the Statesman Journal newspaper (Salem, Oregon, 2005) reports mortgage loan interest rates for 30-year and 15-year
fixed-rate mortgage loans for a number of Willamette Valley lending institutions. Of interest is whether there is any systematic
difference between 30-year rates and 15-year rates (expressed as annual percentage rate or APR) and, if there is, what is the size of
that difference. The following table displays the 30-year rate and the 15-year rate for each of nine lending institutions. Also given is the
difference between the 30-year rate and the 15-year rate for each lending institution. Use the table to compare the 30-year rates and
the 15-year rates. Also, calculate the average of the differences between the rates. (Input the amount as positive value. Round your
answer to 4 decimal places.)
Lending Institution
Blue Ribbon Home Mortgage
Coast To Coast Mortgage Lending
30-Year
15-Year
Difference
3.536
4.420
-0.884
5.281
4.492
0.789
Community Mortgage Services Inc.
Liberty Mortgage
5.567
4.457
1.110
3.803
5.985
-2.182
Jim Morrison's MBI
5.469
4.701
0.768
Professional Valley Mortgage
5.907
6.498
-0.591
Mortgage First
Professional Mortgage Corporation
Resident Lending Group Inc.
3.739
3.606
0.133
5.682
5.008
0.674
4.886
4.491
0.395
Expert Solution
This question has been solved!
Explore an expertly crafted, step-by-step solution for a thorough understanding of key concepts.

This is a popular solution!

Trending now
This is a popular solution!

Step by step
Solved in 2 steps

Knowledge Booster


Learn more about
Need a deep-dive on the concept behind this application? Look no further. Learn more about this topic, statistics and related others by exploring similar questions and additional content below.Recommended textbooks for you