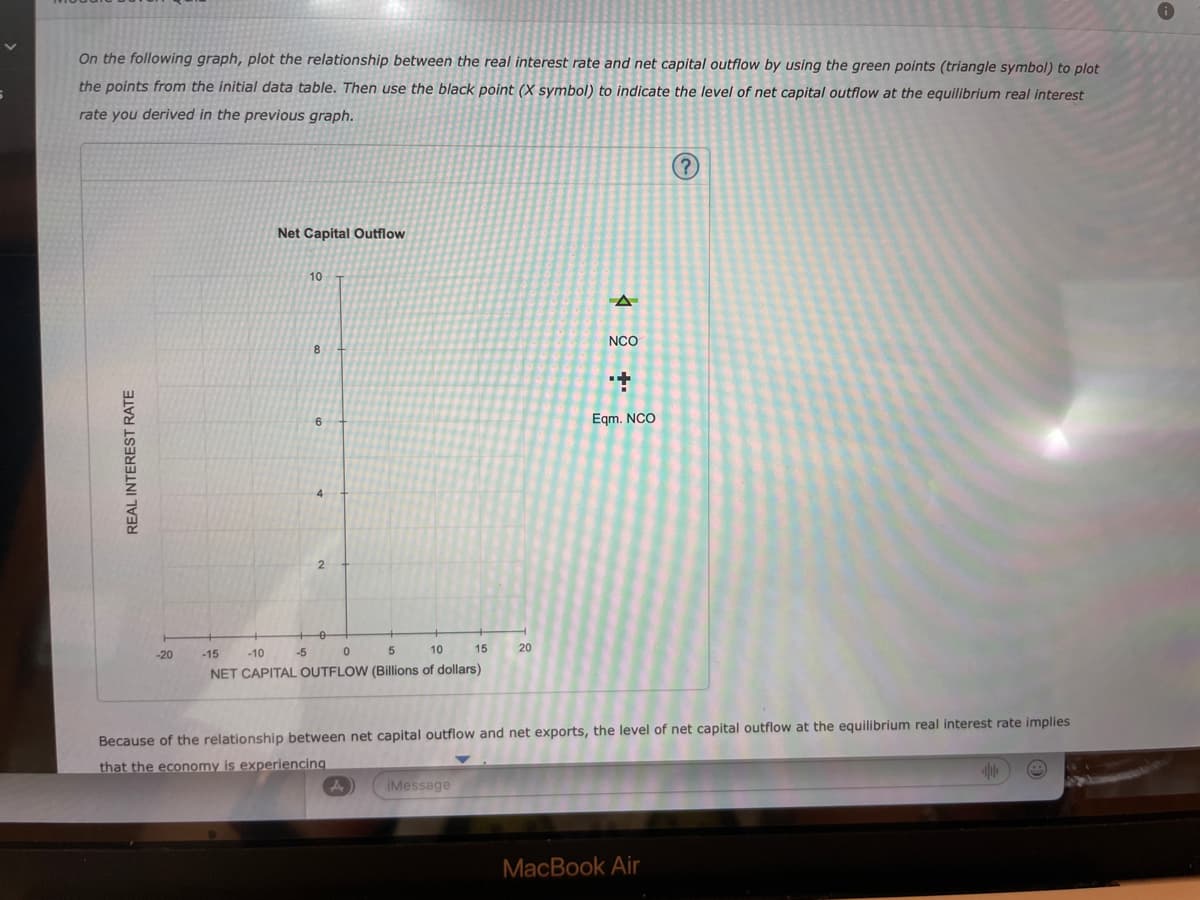
On the following graph, plot the relationship between the real interest rate and net capital outflow by using the green points (triangle symbol) to plot the points from the initial data table. Then use the black point (X symbol) to indicate the level of net capital outflow at the equilibrium real interest rate you derived in the previous graph. REAL INTEREST RATE -20 Net Capital Outflow 10 -5 8 6 -15 0 5 10 -10 NET CAPITAL OUTFLOW (Billions of dollars) 15 20 A NCO + Eqm. NCO (?) Because of the relationship between net capital outflow and net exports, the level of net capital outflow at the equilibrium real interest rate implies that the economy is experiencing h Ⓡ
On the following graph, plot the relationship between the real interest rate and net capital outflow by using the green points (triangle symbol) to plot the points from the initial data table. Then use the black point (X symbol) to indicate the level of net capital outflow at the equilibrium real interest rate you derived in the previous graph. REAL INTEREST RATE -20 Net Capital Outflow 10 -5 8 6 -15 0 5 10 -10 NET CAPITAL OUTFLOW (Billions of dollars) 15 20 A NCO + Eqm. NCO (?) Because of the relationship between net capital outflow and net exports, the level of net capital outflow at the equilibrium real interest rate implies that the economy is experiencing h Ⓡ

Economics: Private and Public Choice (MindTap Course List)
16th Edition
ISBN:9781305506725
Author:James D. Gwartney, Richard L. Stroup, Russell S. Sobel, David A. Macpherson
Publisher:James D. Gwartney, Richard L. Stroup, Russell S. Sobel, David A. Macpherson
Chapter27: Investment, The Capital Market, And The Wealth Of Nations
Section: Chapter Questions
Problem 14CQ

Related questions
Question
Effects of a government budget deficit 2
Transcribed Image Text:On the following graph, plot the relationship between the real interest rate and net capital outflow by using the green points (triangle symbol) to plot
the points from the initial data table. Then use the black point (X symbol) to indicate the level of net capital outflow at the equilibrium real interest
rate you derived in the previous graph.
REAL INTEREST RATE
-20
Net Capital Outflow
10
-5
8
6
-15
-10
0
5
10
NET CAPITAL OUTFLOW (Billions of dollars)
15
A
iMessage
20
A
NCO
ri
Eqm. NCO
Because of the relationship between net capital outflow and net exports, the level of net capital outflow at the equilibrium real interest rate implies
that the economy is experiencing
(?)
MacBook Air
Transcribed Image Text:Because of the relationship between net capital outflow and net exports, the level of net capital outflow at the equilibrium real interest rate implies
that the economy is experiencing
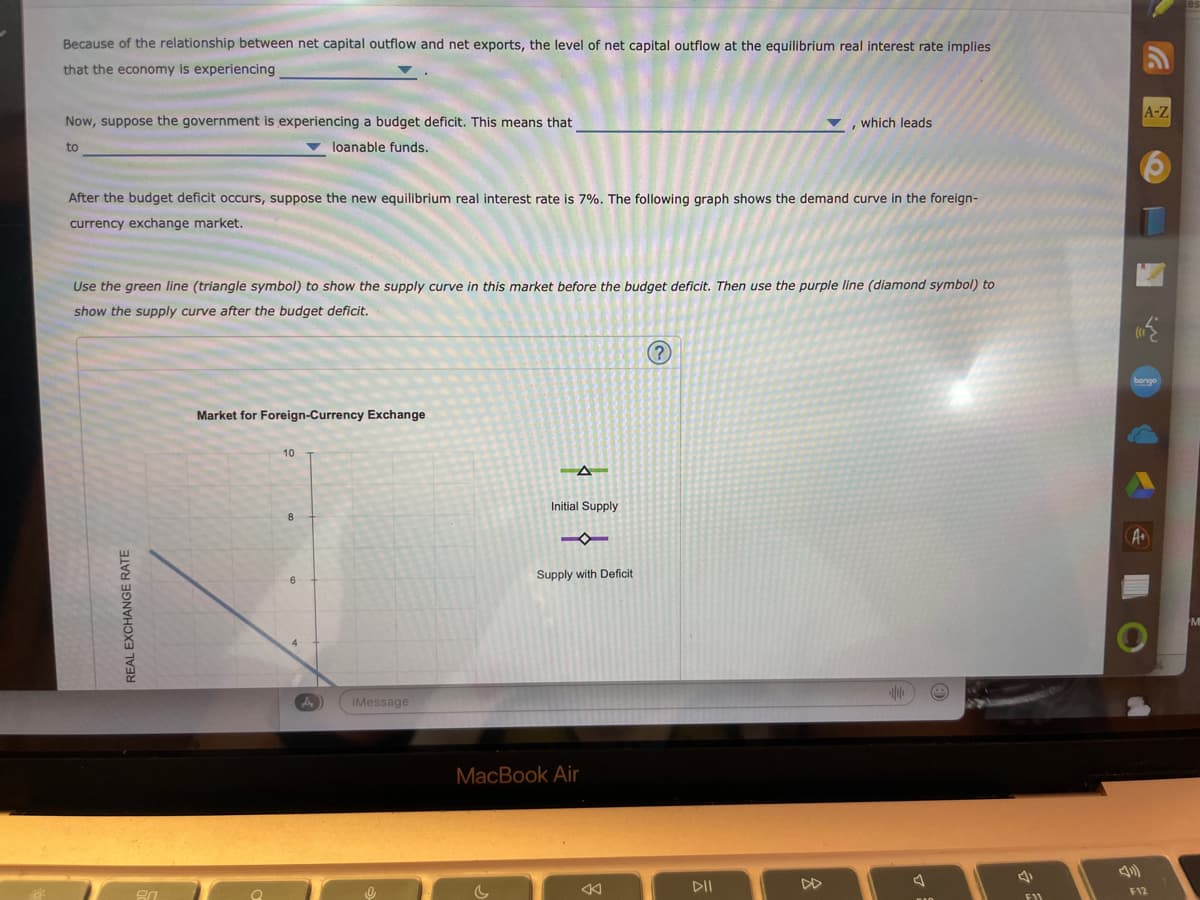
Now, suppose the government is experiencing a budget deficit. This means that
to
loanable funds.
After the budget deficit occurs, suppose the new equilibrium real interest rate is 7%. The following graph shows the demand curve in the foreign-
currency exchange market.
Use the green line (triangle symbol) to show the supply curve in this market before the budget deficit. Then use the purple line (diamond symbol) to
show the supply curve after the budget deficit.
REAL EXCHANGE RATE
20
Market for Foreign-Currency Exchange
10
A
iMessage
-A
Initial Supply
4
Supply with Deficit
MacBook Air
which leads
(?)
DII
a
F11
A-Z
A+
1
F12
Expert Solution
This question has been solved!
Explore an expertly crafted, step-by-step solution for a thorough understanding of key concepts.

This is a popular solution!

Trending now
This is a popular solution!

Step by step
Solved in 2 steps with 1 images

Knowledge Booster


Learn more about
Need a deep-dive on the concept behind this application? Look no further. Learn more about this topic, economics and related others by exploring similar questions and additional content below.Recommended textbooks for you
Economics: Private and Public Choice (MindTap Cou…
Economics
ISBN:
9781305506725
Author:
James D. Gwartney, Richard L. Stroup, Russell S. Sobel, David A. Macpherson
Publisher:
Cengage Learning

Microeconomics: Private and Public Choice (MindTa…
Economics
ISBN:
9781305506893
Author:
James D. Gwartney, Richard L. Stroup, Russell S. Sobel, David A. Macpherson
Publisher:
Cengage Learning
Economics: Private and Public Choice (MindTap Cou…
Economics
ISBN:
9781305506725
Author:
James D. Gwartney, Richard L. Stroup, Russell S. Sobel, David A. Macpherson
Publisher:
Cengage Learning
Microeconomics: Private and Public Choice (MindTa…
Economics
ISBN:
9781305506893
Author:
James D. Gwartney, Richard L. Stroup, Russell S. Sobel, David A. Macpherson
Publisher:
Cengage Learning