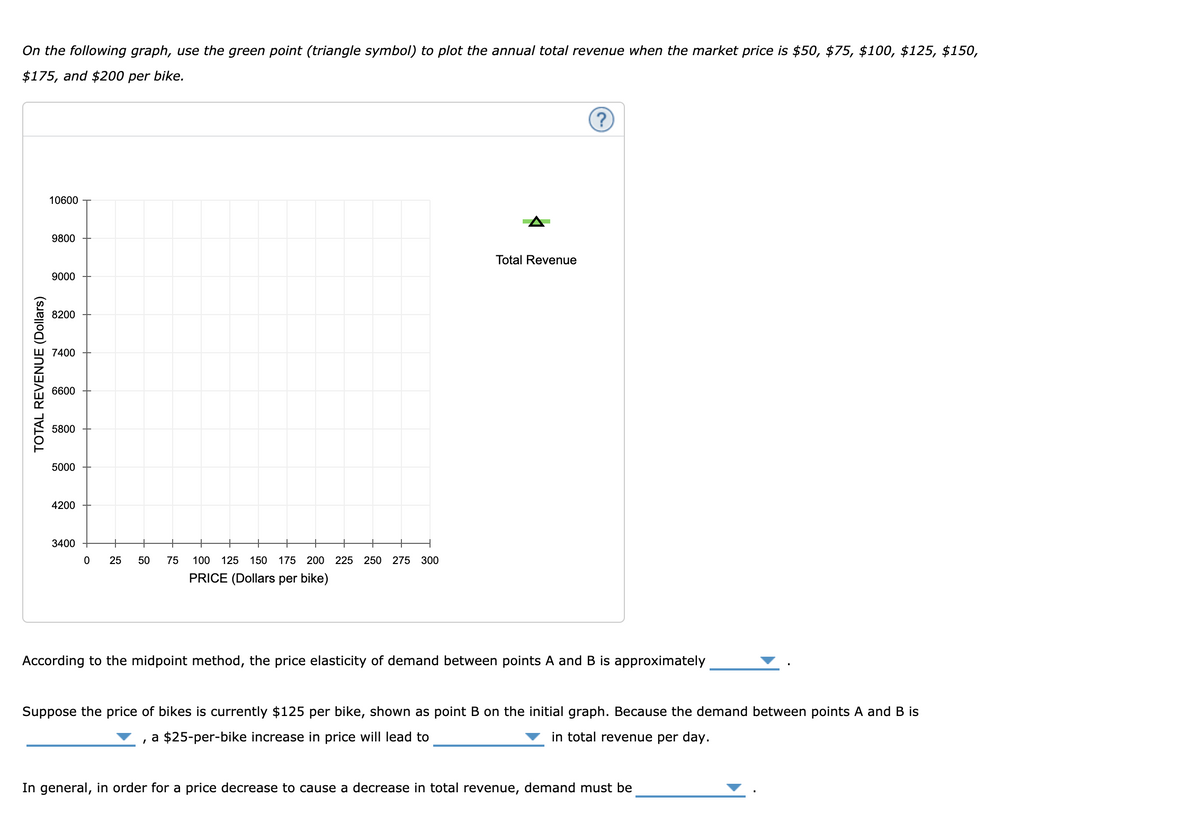
On the following graph, use the green point (triangle symbol) to plot the annual total revenue when the market price is $50, $75, $100, $125, $150, $175, and $200 per bike. 10600 9800 Total Revenue 9000 8200 7400 6600 5800 5000 4200 3400 25 50 75 100 125 150 175 200 225 250 275 300 PRICE (Dollars per bike) According to the midpoint method, the price elasticity of demand between points A and B is approximately Suppose the price of bikes is currently $125 per bike, shown as point B on the initial graph. Because the demand between points A and B is , a $25-per-bike increase in price will lead to v in total revenue per day. In general, in order for a price decrease to cause a decrease in total revenue, demand must be TOTAL REVENUE (Dollars)
On the following graph, use the green point (triangle symbol) to plot the annual total revenue when the market price is $50, $75, $100, $125, $150, $175, and $200 per bike. 10600 9800 Total Revenue 9000 8200 7400 6600 5800 5000 4200 3400 25 50 75 100 125 150 175 200 225 250 275 300 PRICE (Dollars per bike) According to the midpoint method, the price elasticity of demand between points A and B is approximately Suppose the price of bikes is currently $125 per bike, shown as point B on the initial graph. Because the demand between points A and B is , a $25-per-bike increase in price will lead to v in total revenue per day. In general, in order for a price decrease to cause a decrease in total revenue, demand must be TOTAL REVENUE (Dollars)

Glencoe Algebra 1, Student Edition, 9780079039897, 0079039898, 2018
18th Edition
ISBN:9780079039897
Author:Carter
Publisher:Carter
Chapter10: Statistics
Section10.2: Representing Data
Problem 13PPS

Related questions
Question
Transcribed Image Text:On the following graph, use the green point (triangle symbol) to plot the annual total revenue when the market price is $50, $75, $100, $125, $150,
$175, and $200 per bike.
10600
9800
Total Revenue
9000
8200
7400
6600
5800
5000
4200
3400
+
25
50
75
100 125 150
175 200 225 250 275 300
PRICE (Dollars per bike)
According to the midpoint method, the price elasticity of demand between points A and B is approximately
Suppose the price of bikes is currently $125 per bike, shown as point B on the initial graph. Because the demand between points A and B is
a $25-per-bike increase in price will lead to
in total revenue per day.
In general, in order for a price decrease to cause a decrease in total revenue, demand must be
TOTAL REVENUE (Dollars)
Expert Solution
This question has been solved!
Explore an expertly crafted, step-by-step solution for a thorough understanding of key concepts.

This is a popular solution!

Trending now
This is a popular solution!

Step by step
Solved in 2 steps with 2 images

Recommended textbooks for you
Glencoe Algebra 1, Student Edition, 9780079039897…
Algebra
ISBN:
9780079039897
Author:
Carter
Publisher:
McGraw Hill


Trigonometry (MindTap Course List)
Trigonometry
ISBN:
9781337278461
Author:
Ron Larson
Publisher:
Cengage Learning
Glencoe Algebra 1, Student Edition, 9780079039897…
Algebra
ISBN:
9780079039897
Author:
Carter
Publisher:
McGraw Hill
Trigonometry (MindTap Course List)
Trigonometry
ISBN:
9781337278461
Author:
Ron Larson
Publisher:
Cengage Learning

Elementary Algebra
Algebra
ISBN:
9780998625713
Author:
Lynn Marecek, MaryAnne Anthony-Smith
Publisher:
OpenStax - Rice University

Algebra & Trigonometry with Analytic Geometry
Algebra
ISBN:
9781133382119
Author:
Swokowski
Publisher:
Cengage