One-Way Analysis of Variance The values in the table are measured maximum breadths of male Egyptian skulls from different epochs (based on data from Ancient Races of the Thebaid, by Thomson and Randall-Maciver). Changes in head shape over time suggest that interbreeding occurred with immigrant populations. Use a 0.05 significance let to test the claim that the different epochs do not all have the same mean. 4000 в.с. 1850 в.с. 150 А.D. 131 129 128 138 134 138 125 136 136 129 137 139 132 137 141 135 129 142 132 136 137
One-Way Analysis of Variance The values in the table are measured maximum breadths of male Egyptian skulls from different epochs (based on data from Ancient Races of the Thebaid, by Thomson and Randall-Maciver). Changes in head shape over time suggest that interbreeding occurred with immigrant populations. Use a 0.05 significance let to test the claim that the different epochs do not all have the same mean. 4000 в.с. 1850 в.с. 150 А.D. 131 129 128 138 134 138 125 136 136 129 137 139 132 137 141 135 129 142 132 136 137

MATLAB: An Introduction with Applications
6th Edition
ISBN:9781119256830
Author:Amos Gilat
Publisher:Amos Gilat
Chapter1: Starting With Matlab
Section: Chapter Questions
Problem 1P

Related questions
Question
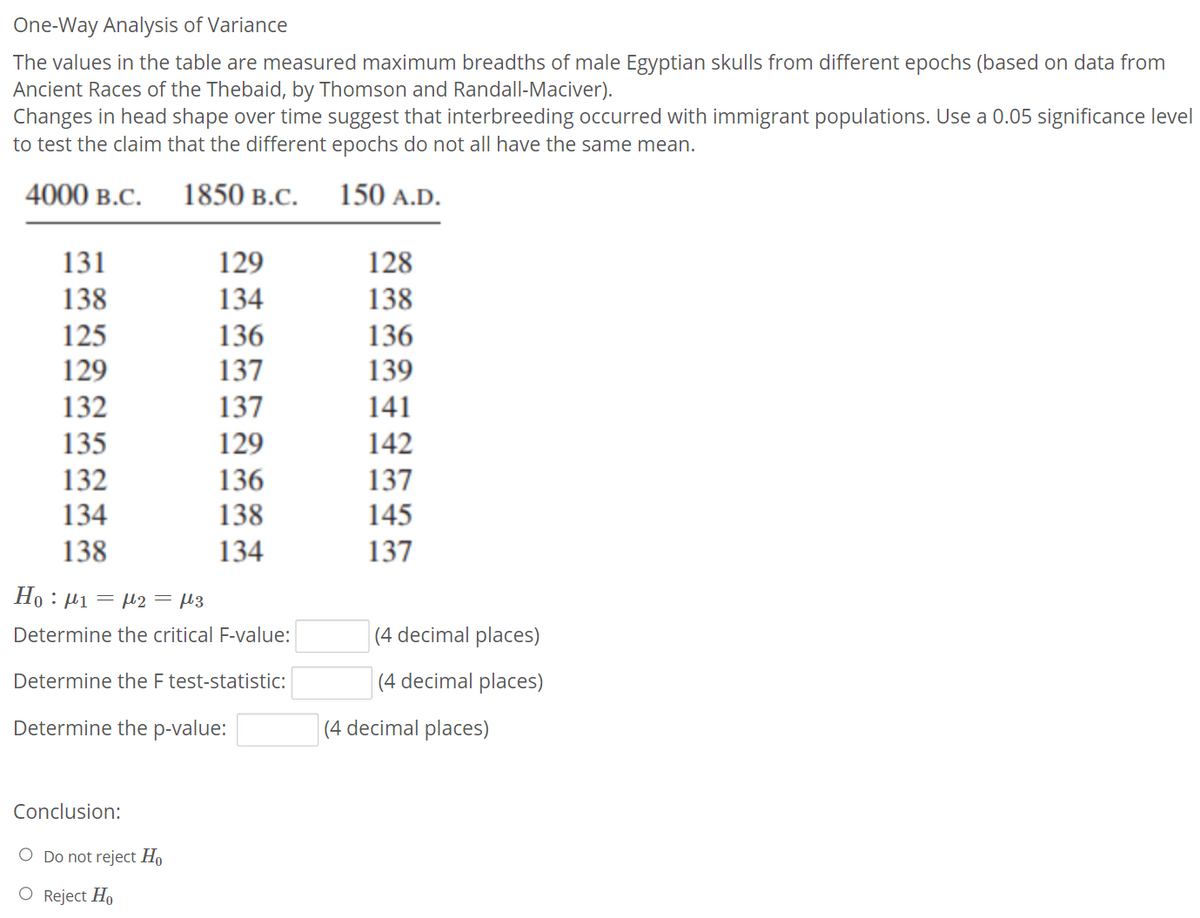
Transcribed Image Text:One-Way Analysis of Variance
The values in the table are measured maximum breadths of male Egyptian skulls from different epochs (based on data from
Ancient Races of the Thebaid, by Thomson and Randall-Maciver).
Changes in head shape over time suggest that interbreeding occurred with immigrant populations. Use a 0.05 significance level
to test the claim that the different epochs do not all have the same mean.
4000 B.C.
1850 B.C.
150 A.D.
131
129
128
138
134
138
125
136
136
129
137
139
132
137
141
135
129
142
132
136
138
137
134
145
138
134
137
Ho : µ1 = µ2 = µ3
Determine the critical F-value:
|(4 decimal places)
Determine the F test-statistic:
(4 decimal places)
Determine the p-value:
(4 decimal places)
Conclusion:
O Do not reject Ho
O Reject Ho
Expert Solution
This question has been solved!
Explore an expertly crafted, step-by-step solution for a thorough understanding of key concepts.

This is a popular solution!

Trending now
This is a popular solution!

Step by step
Solved in 3 steps with 2 images

Knowledge Booster


Learn more about
Need a deep-dive on the concept behind this application? Look no further. Learn more about this topic, statistics and related others by exploring similar questions and additional content below.Recommended textbooks for you
MATLAB: An Introduction with Applications
Statistics
ISBN:
9781119256830
Author:
Amos Gilat
Publisher:
John Wiley & Sons Inc

Probability and Statistics for Engineering and th…
Statistics
ISBN:
9781305251809
Author:
Jay L. Devore
Publisher:
Cengage Learning

Statistics for The Behavioral Sciences (MindTap C…
Statistics
ISBN:
9781305504912
Author:
Frederick J Gravetter, Larry B. Wallnau
Publisher:
Cengage Learning
MATLAB: An Introduction with Applications
Statistics
ISBN:
9781119256830
Author:
Amos Gilat
Publisher:
John Wiley & Sons Inc
Probability and Statistics for Engineering and th…
Statistics
ISBN:
9781305251809
Author:
Jay L. Devore
Publisher:
Cengage Learning
Statistics for The Behavioral Sciences (MindTap C…
Statistics
ISBN:
9781305504912
Author:
Frederick J Gravetter, Larry B. Wallnau
Publisher:
Cengage Learning

Elementary Statistics: Picturing the World (7th E…
Statistics
ISBN:
9780134683416
Author:
Ron Larson, Betsy Farber
Publisher:
PEARSON

The Basic Practice of Statistics
Statistics
ISBN:
9781319042578
Author:
David S. Moore, William I. Notz, Michael A. Fligner
Publisher:
W. H. Freeman

Introduction to the Practice of Statistics
Statistics
ISBN:
9781319013387
Author:
David S. Moore, George P. McCabe, Bruce A. Craig
Publisher:
W. H. Freeman