
Concept explainers
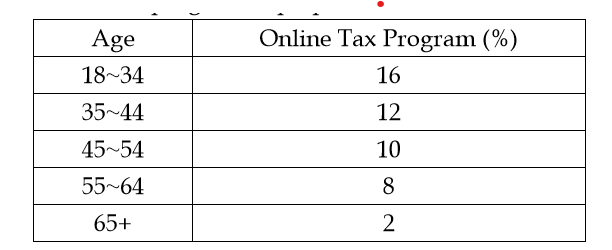
The following table shows the percentage of individuals in each age group who use an online tax program to prepare their federal income tax return. Age Online Tax Program (%) 18~34 16 35~44 12 45~54 10 55~64 8 65+ 2 Suppose a follow-up study consisting of personal interviews is to be conducted to determine the most important factors in selecting a method for filing taxes.
(1) How many 18~34-year-olds must be sampled to find an expected number of at least 25 who use an online tax program to prepare their federal income tax return?
(2) How many 35~44-year-olds must be sampled to find an expected number of at least 25 who use an online tax program to prepare their federal income tax return?
(3) How many 65+-year-olds must be sampled to find an expected number of at least 25 who use an online tax program to prepare their federal income tax return?
(4) If the number of 18~34-year-olds sampled is equal to the value identified in part (1), what is the standard deviation of the percentage who use an online tax program?
(5) If the number of 35~44-year-olds sampled is equal to the value identified in part (2), what is the standard deviation of the percentage who use an online tax program?


Trending nowThis is a popular solution!
Step by stepSolved in 8 steps with 6 images

- The Student Union President conducted a survey to estimate the proportion of first year students who participated in the social activities organized by the Student Union. Which of the following surveying options does NOT affect the presidents ability to generalize the survey to all first year students. The president put the survey on the Student Union webpage a Monday and collected the responses at the end of the week. All of the other options present a problem for generalizing the results. The president polled all students coming out of the Student Union on a given Monday. The freshmen class consists of 3000 students. A random sample of only 300 were sent a survey. Only 150 responded. The survey was sent only to first year students enrolled in statistics courses because all students need to satisfy a statistics general education requirement.arrow_forwardUse the data (a sample of 20 banks) given below to answer the following question(s). financial Obs condition TotCap/Assets TotExp/Assets TotLnsLses/ Assets 1 1 9.7 0.12 0.65 2 1 1 0.11 0.62 3 1 6.9 0.09 1.02 4 1 5.8 0.1 0.67 1 4.3 0.11 0.69 6. 1 9.1 0.13 0.74 7 1 11.9 0.1 0.79 8 1 8.1 0.13 0.63 9 9.3 0.16 0.72 10 1.1 0.16 0.57 11 11.1 0.08 0.43 12 20.5 0.12 0.8 13 9.8 0.07 0.69 14 7.9 0.08 0.53 15 9.6 0.09 0.73 16 12.5 0.09 0.3 17 18.3 0.08 0.49 18 7.2 0.11 0.55 19 14 0.08 0.44 20 8.3 0.08 0.51 The "Financial Condition" column records the judgment of an expert on the financial condition of each bank. This dependent variable takes one of two possible values--weak or strong ---according to the financial condition of the bank. The predictors are two ratios used in the financial analysis of banks: TotLnsLses/Assets is the ratio of total loans and leases to total assets, and TotExp/Assets is the ratio of total expenses to total assets. The target is to use the two ratios for classifying the…arrow_forward1. To understand the cooking and diet patterns of Americans, a research company surveyed 12,340 American adults (age 18 and older) during the year 2014 and asked about a variety of factors including age, gender, yearly income (in US $), and the number of hours spent cooking each week. Answer the following questions regarding the context of the survey: a. WHO is being measured? (What is the sample?) b. WHAT is being measured? (What are the variables?) For each variable, identify whether it is quantitative or categorical.arrow_forward
- The General Social Survey is an annual survey given to a random selection of about 1500 adults in the United States. Among the many questions asked are "What is the highest level of education you've completed?" and "If you're employed full-time, how many hours do you spend working at your job during a typical week?" In a recent year, 1079 respondents answered both questions. The summary statistics are given in the chart below. (The sample data consist of the times, in hours per week, that were given by the respondents.) Sample Sample Sample size Groups mean variance Less than h.s. High school Bachelor's 258 40.9 101.8 263 41.8 97.5 270 42.2 94.4 Graduate 288 43.0 98.7 Send data to calculator Send data to Excel To decide if there are any differences in the mean hours per week worked by these different groups, we can perform a one-way, independent-samples ANOVA test. Such a test uses the following statistic. Variation between the samples F= Variation within the samples For the data from…arrow_forwardThirty-seven percent of all Americans drink bottled water more than once a week (Natural resources Defense Council, December 4, 2015). Suppose you have been hired by the Natural Resources Defence Council to investigate bottled water consumption in St. Paul. You plan to select a sample of St. Paulites to estimate the proportion who drink bottled water more than once a week. Assume the popluation proportion of St. Paulites who drink bottled water more than once a week is 0.37, the same as the overall proportion of Americans who drink bottled water more than once a week. Use z-table. a. Suppose you select a sample of 540 St.Paulites. Show the sampling distribution of (to 4 decimals).E(p) = __________σ = _________ b. Based upon a sample of 540 St. Paulites, what is the probability that the sample proportion will be within 0.01 of the population proportion (to 4 decimals).probability = _________ c. Suppose you select a sample of 150 St.Paulites. Show the sampling distribution of p (to 4…arrow_forwardThe General Social Survey is an annual survey given to a random selection of about 1500 adults in the United States. Among the many questions asked are "What is the highest level of education you've completed?" and "If you're employed full-time, how many hours do you spend working at your job during a typical week?" In a recent year, 1116 respondents answered both questions. The summary statistics are given in the chart below. (The sample data consist of the times, in hours per week, that were given by the respondents.) Sample Sample Sample Groups size mean variance Less than 281 41.6 115.8 h.s. High school 260 43.3 96.3 Bachelor's 294 42.5 100.5 Graduate 281 44.2 108.2 Send data to Excel Based on these summary statistics, we perform a one-way, independent-samples ANOVA test to determine if there is a difference in the mean hours worked in a typical week among the four populations of workers. (a) The results of this ANOVA are given in the incomplete ANOVA table below. Complete the…arrow_forward
- A Deloitte employment survey asked a sample of human resource executives how their company planned to change its workforce over the next 12 months. A categorical response variable showed three options: the company plans to hire and add to the number of employees, the company plans no change in the number of employees, or the company plans to lay off and reduce the number of employees. Another categorical variable indicated if the company was private or public. Sample data for 180 companies are summarized as follows. Employment Plan Company Private Public Add Employees 37 32 No Change 19 34 Lay Off Employees 16 42 1) Conduct a test of independence to determine if the employment plan for the next 12 months is independent of the type of company. State the null and alternative hypotheses. A) H0: Employment plan is not mutually exclusive from the type of company. Ha: Employment plan is mutually exclusive from the type of company. B) H0: Employment plan is not independent of…arrow_forwardInternational experience around the world is important in our culture of globalization. According to NAFSA, 54.5% of all American students traveling abroad went to Europe in the 2014-2015 academic year. To determine if there is shift in the proportion of students traveling to Europe, suppose a random sample of 300 students who had studied abroad was taken for the 2015-2016 school year. One-hundred sixty of the students traveled to Europe. a. Conduct a test to determine if the proportion of students traveling to Europe has changed. Be sure to provide a complete write-up. b. Based on the hypothesis test, would you expect 0.545 to be in confidence interval for the proportion? Explain without constructing the interval.arrow_forwardA programmer plans to develop a new software system. In planning for the operating system that he will use, he needs to estimate the percentage of computers that use a new operating system. How many computers must be surveyed in order to be 99% confident that his estimate is in error by no more than three percentage points? Complete parts (a) through (c) below. Question content area bottom Part 1 a) Assume that nothing is known about the percentage of computers with new operating systems. n=enter your response here (Round up to the nearest integer.) Part 2 b) Assume that a recent survey suggests that about 90% of computers use a new operating system. n=enter your response here (Round up to the nearest integer.) Part 3arrow_forward
- MATLAB: An Introduction with ApplicationsStatisticsISBN:9781119256830Author:Amos GilatPublisher:John Wiley & Sons IncProbability and Statistics for Engineering and th...StatisticsISBN:9781305251809Author:Jay L. DevorePublisher:Cengage LearningStatistics for The Behavioral Sciences (MindTap C...StatisticsISBN:9781305504912Author:Frederick J Gravetter, Larry B. WallnauPublisher:Cengage Learning
- Elementary Statistics: Picturing the World (7th E...StatisticsISBN:9780134683416Author:Ron Larson, Betsy FarberPublisher:PEARSONThe Basic Practice of StatisticsStatisticsISBN:9781319042578Author:David S. Moore, William I. Notz, Michael A. FlignerPublisher:W. H. FreemanIntroduction to the Practice of StatisticsStatisticsISBN:9781319013387Author:David S. Moore, George P. McCabe, Bruce A. CraigPublisher:W. H. Freeman


