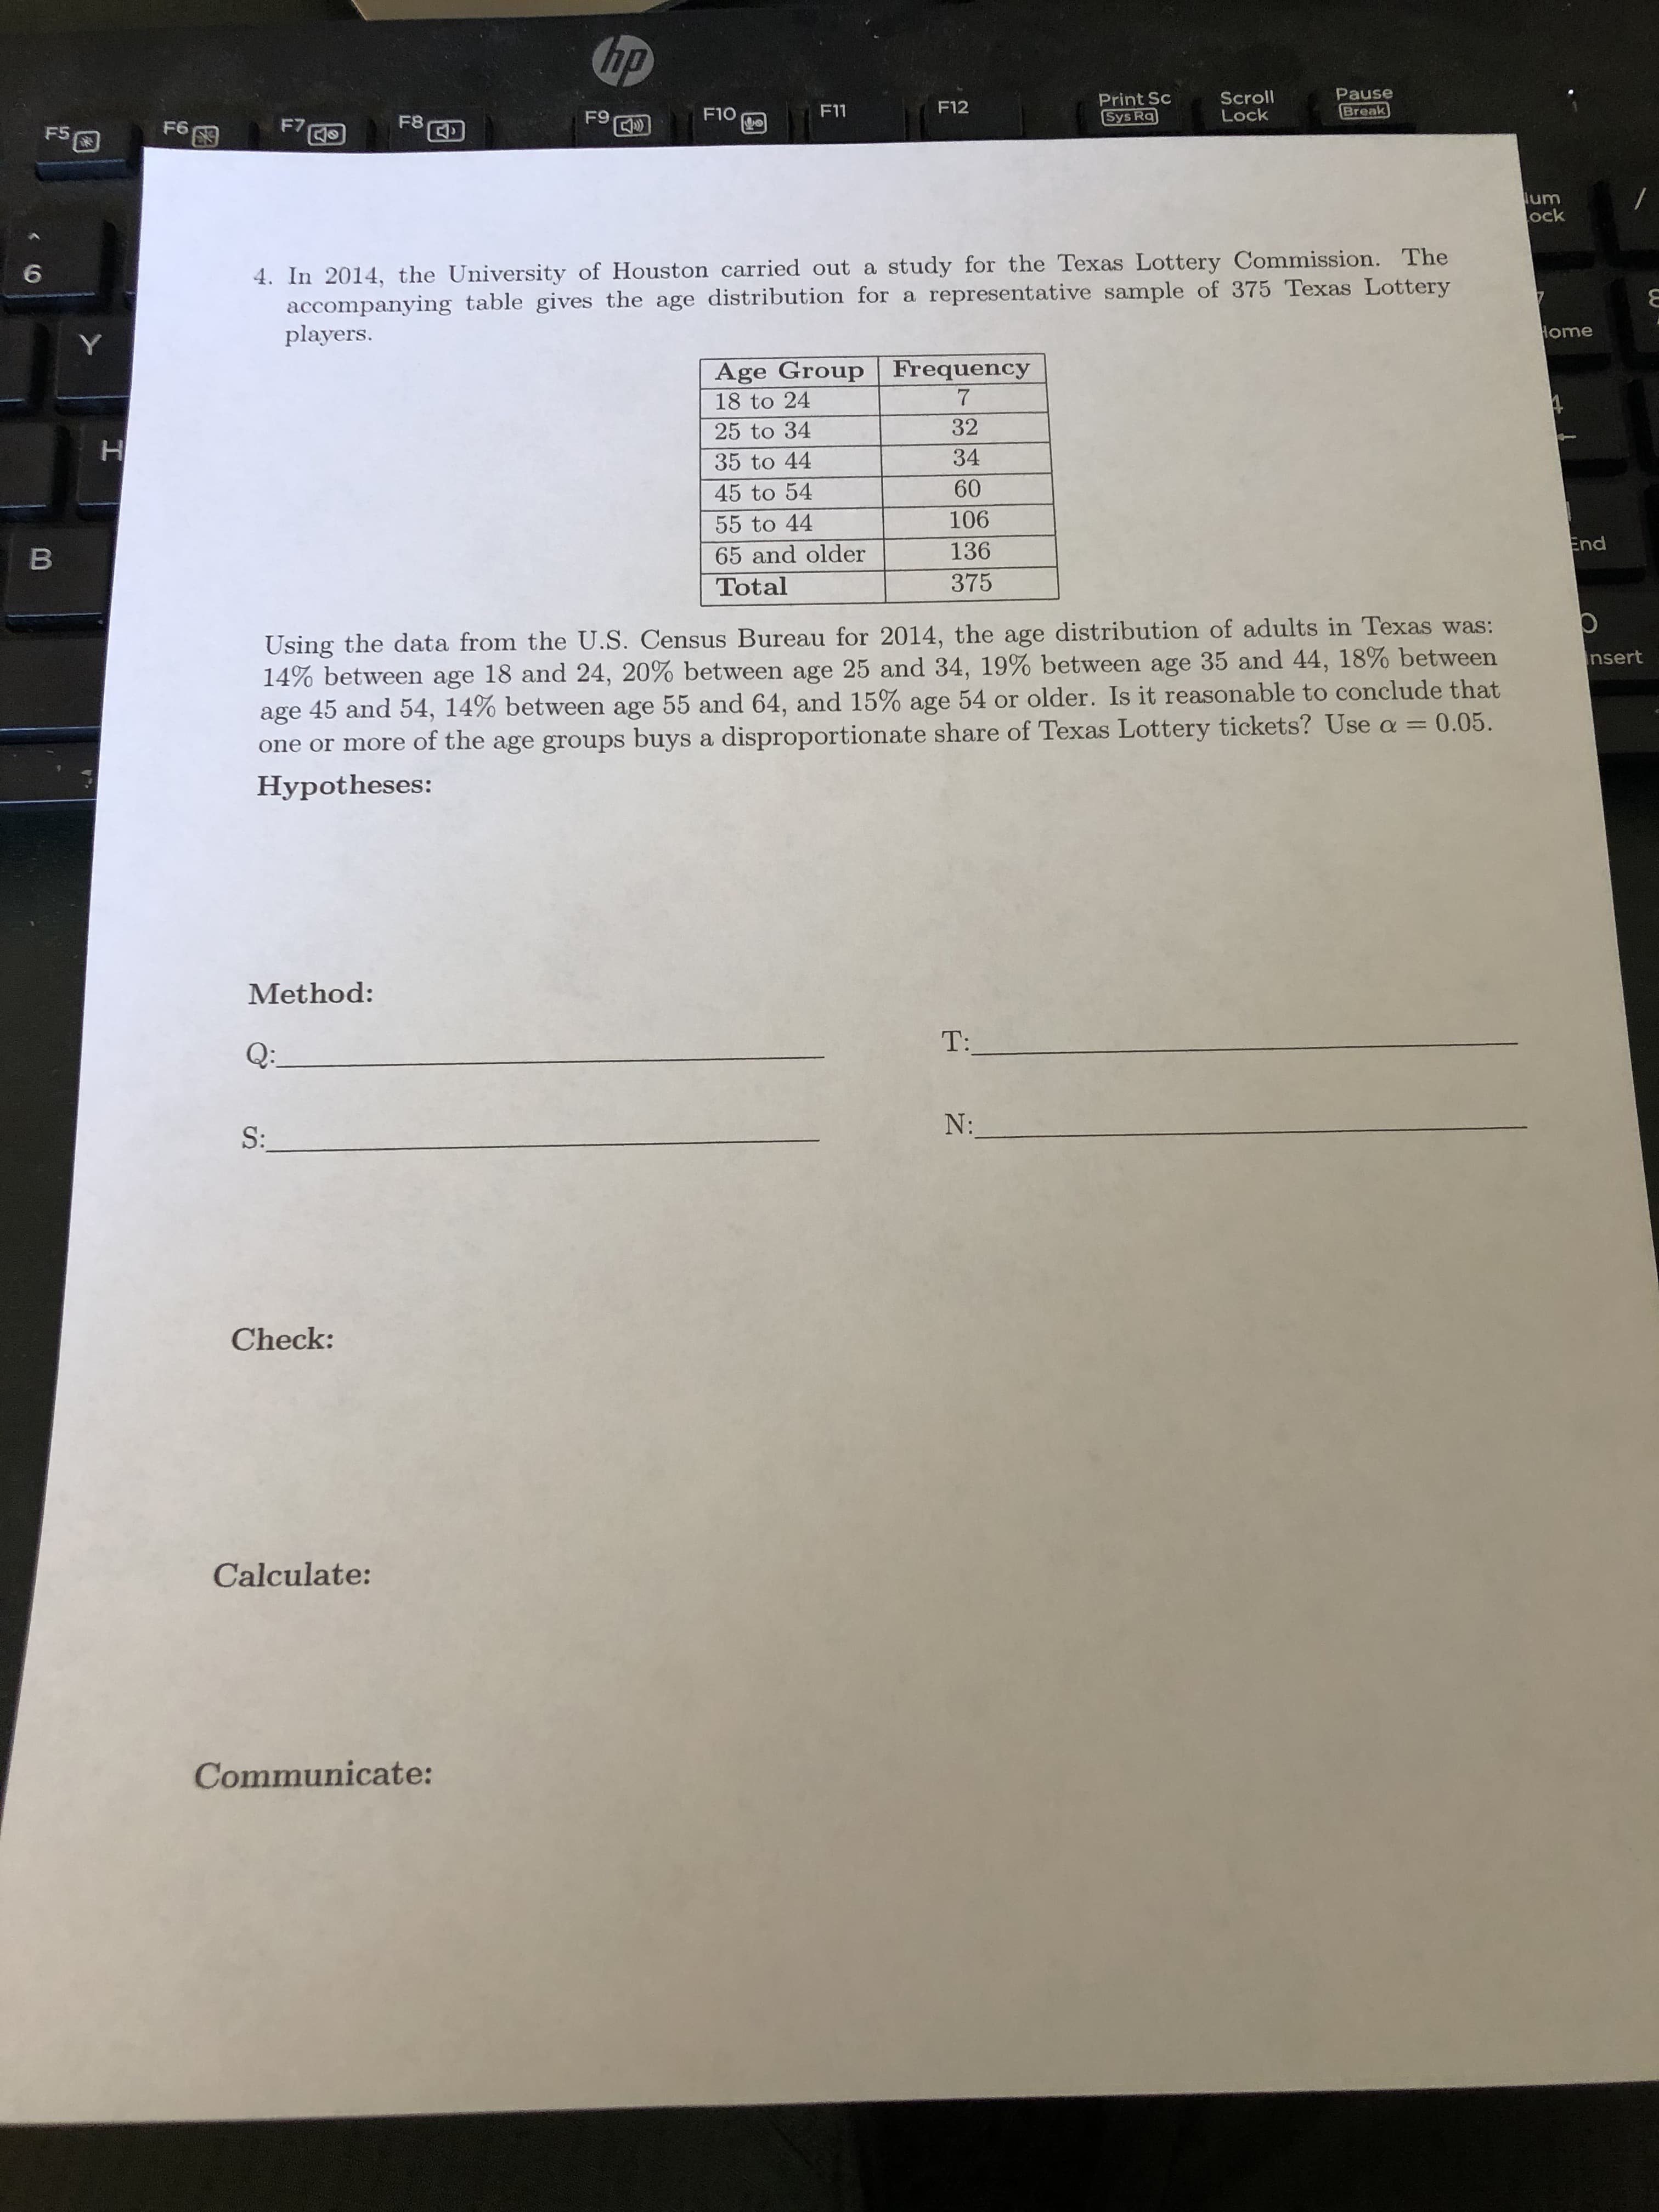
4. In 2014, the University of Houston carried out a study for the Texas Lottery Commission. The accompanying table gives the age distribution for a representative sample of 375 Texas Lottery players. Age Group Frequency 18 to 24 25 to 34 32 35 to 44 34 45 to 54 60 55 to 44 106 65 and older Total 136 375 Using the data from the U.S. Census Bureau for 2014, the age distribution of adults in Texas was: 14% between age 18 and 24, 20% between age 25 and 34, 19% between age 35 and 44, 18% between age 45 and 54, 14% between age 55 and 64, and 15% age 54 or older. Is it reasonable to conclude that one or more of the age groups buys a disproportionate share of Texas Lottery tickets? Use a = 0.05.
4. In 2014, the University of Houston carried out a study for the Texas Lottery Commission. The accompanying table gives the age distribution for a representative sample of 375 Texas Lottery players. Age Group Frequency 18 to 24 25 to 34 32 35 to 44 34 45 to 54 60 55 to 44 106 65 and older Total 136 375 Using the data from the U.S. Census Bureau for 2014, the age distribution of adults in Texas was: 14% between age 18 and 24, 20% between age 25 and 34, 19% between age 35 and 44, 18% between age 45 and 54, 14% between age 55 and 64, and 15% age 54 or older. Is it reasonable to conclude that one or more of the age groups buys a disproportionate share of Texas Lottery tickets? Use a = 0.05.

Glencoe Algebra 1, Student Edition, 9780079039897, 0079039898, 2018
18th Edition
ISBN:9780079039897
Author:Carter
Publisher:Carter
Chapter10: Statistics
Section10.6: Summarizing Categorical Data
Problem 10CYU

Related questions

Question
Transcribed Image Text:4. In 2014, the University of Houston carried out a study for the Texas Lottery Commission. The
accompanying table gives the age distribution for a representative sample of 375 Texas Lottery
players.
Age Group Frequency
18 to 24
25 to 34
32
35 to 44
34
45 to 54
60
55 to 44
106
65 and older
Total
136
375
Using the data from the U.S. Census Bureau for 2014, the age distribution of adults in Texas was:
14% between age 18 and 24, 20% between age 25 and 34, 19% between age 35 and 44, 18% between
age 45 and 54, 14% between age 55 and 64, and 15% age 54 or older. Is it reasonable to conclude that
one or more of the age groups buys a disproportionate share of Texas Lottery tickets? Use a = 0.05.
Expert Solution
This question has been solved!
Explore an expertly crafted, step-by-step solution for a thorough understanding of key concepts.

This is a popular solution!

Trending now
This is a popular solution!

Step by step
Solved in 2 steps

Knowledge Booster


Learn more about
Need a deep-dive on the concept behind this application? Look no further. Learn more about this topic, statistics and related others by exploring similar questions and additional content below.Recommended textbooks for you
Glencoe Algebra 1, Student Edition, 9780079039897…
Algebra
ISBN:
9780079039897
Author:
Carter
Publisher:
McGraw Hill
Glencoe Algebra 1, Student Edition, 9780079039897…
Algebra
ISBN:
9780079039897
Author:
Carter
Publisher:
McGraw Hill