ONLY PART D) You are the manager for a monopoly with costs, demand, and marginal revenue as in the graph at the top on Figure 1. a. Does the fact that you operate in a monopoly always guarantee that you can achieve higher profits by increasing the price? b. Draw the area representing the profits on the top graph on Figure c. Suppose one of your suppliers just announced an increase in prices for a specific part that your product requires. What should the impact be to each of the curves on the top graph of Figure 1? Explain d. Suppose economic conditions change in such a way that the demand curve for your company shifts Draw a demand curve on the bottom graph on Figure 1 that leads to zero economic profits. Draw a demand curve on the bottom graph on Figure 1 such that any further leftward demand shift will cause you to shut down.
ONLY PART D) You are the manager for a monopoly with costs, demand, and marginal revenue as in the graph at the top on Figure 1. a. Does the fact that you operate in a monopoly always guarantee that you can achieve higher profits by increasing the price? b. Draw the area representing the profits on the top graph on Figure c. Suppose one of your suppliers just announced an increase in prices for a specific part that your product requires. What should the impact be to each of the curves on the top graph of Figure 1? Explain d. Suppose economic conditions change in such a way that the demand curve for your company shifts Draw a demand curve on the bottom graph on Figure 1 that leads to zero economic profits. Draw a demand curve on the bottom graph on Figure 1 such that any further leftward demand shift will cause you to shut down.

Microeconomics A Contemporary Intro
10th Edition
ISBN:9781285635101
Author:MCEACHERN
Publisher:MCEACHERN
Chapter15: Economic Regulation And Antitrust Policy
Section: Chapter Questions
Problem 10PAE

Related questions

Question
(ONLY PART D)
You are the manager for a
a. Does the fact that you operate in a monopoly always guarantee that you can achieve higher profits by increasing the price?
b. Draw the area representing the profits on the top graph on Figure
c. Suppose one of your suppliers just announced an increase in prices for a specific part that your product requires. What should the impact be to each of the curves on the top graph of Figure 1? Explain
d. Suppose economic conditions change in such a way that the demand curve for your company shifts
-
- Draw a demand curve on the bottom graph on Figure 1 that leads to zero economic profits.
- Draw a demand curve on the bottom graph on Figure 1 such that any further leftward demand shift will cause you to shut down.
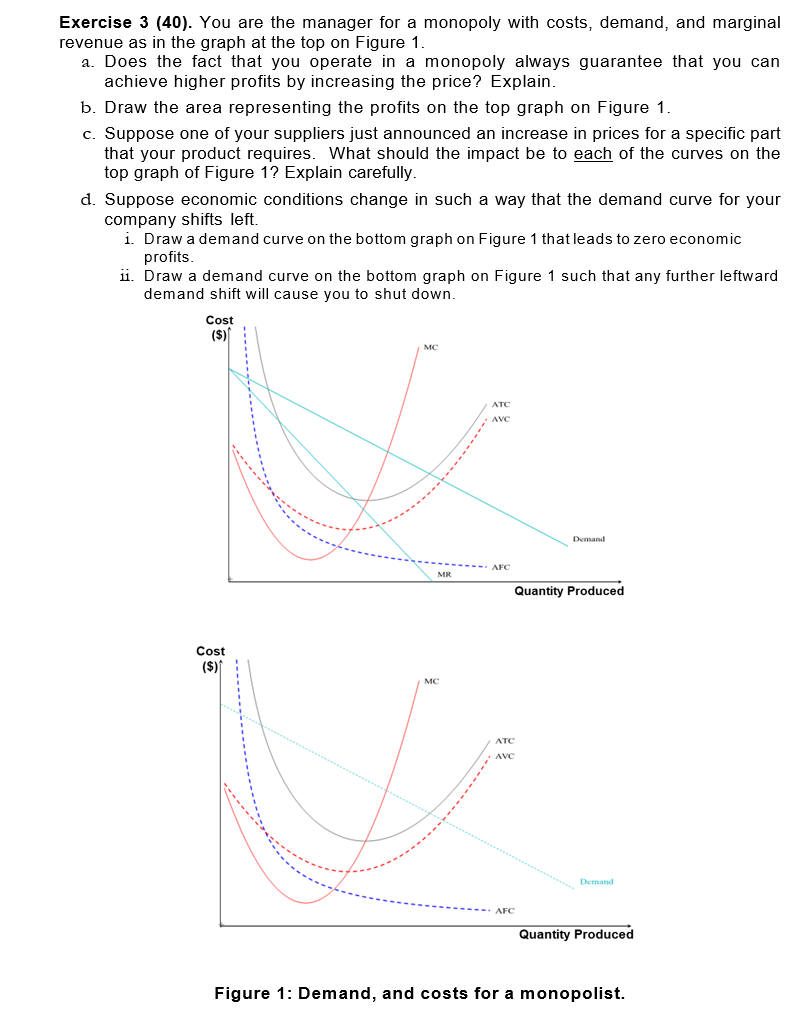
Transcribed Image Text:Exercise 3 (40). You are the manager for a monopoly with costs, demand, and marginal
revenue as in the graph at the top on Figure 1.
a. Does the fact that you operate in a monopoly always guarantee that you can
achieve higher profits by increasing the price? Explain.
b. Draw the area representing the profits on the top graph on Figure 1.
c. Suppose one of your suppliers just announced an increase in prices for a specific part
that your product requires. What should the impact be to each of the curves on the
top graph of Figure 1? Explain carefully.
d. Suppose economic conditions change in such a way that the demand curve for your
company shifts left.
i. Draw a demand curve on the bottom graph on Figure 1 that leads to zero economic
profits.
ii. Draw a demand curve on the bottom graph on Figure 1 such that any further leftward
demand shift will cause you to shut down.
Cost
($)
MC
ATC
AVC
Demand
AFC
Quantity Produced
Cost
($)
MC
ATC
AVC
Demand
Quantity Produced
Figure 1: Demand, and costs for a monopolist.
Expert Solution
This question has been solved!
Explore an expertly crafted, step-by-step solution for a thorough understanding of key concepts.

This is a popular solution!

Trending now
This is a popular solution!

Step by step
Solved in 3 steps with 2 images

Knowledge Booster


Learn more about
Need a deep-dive on the concept behind this application? Look no further. Learn more about this topic, economics and related others by exploring similar questions and additional content below.Recommended textbooks for you

Essentials of Economics (MindTap Course List)
Economics
ISBN:
9781337091992
Author:
N. Gregory Mankiw
Publisher:
Cengage Learning

Exploring Economics
Economics
ISBN:
9781544336329
Author:
Robert L. Sexton
Publisher:
SAGE Publications, Inc
Essentials of Economics (MindTap Course List)
Economics
ISBN:
9781337091992
Author:
N. Gregory Mankiw
Publisher:
Cengage Learning
Exploring Economics
Economics
ISBN:
9781544336329
Author:
Robert L. Sexton
Publisher:
SAGE Publications, Inc

Managerial Economics: Applications, Strategies an…
Economics
ISBN:
9781305506381
Author:
James R. McGuigan, R. Charles Moyer, Frederick H.deB. Harris
Publisher:
Cengage Learning

Economics (MindTap Course List)
Economics
ISBN:
9781337617383
Author:
Roger A. Arnold
Publisher:
Cengage Learning