on't know the cause at this point, but we t looking. these two people might very well have red. In a total quality setting, that deci- sidered the last resort. Most employees job and will if they are provided with urces and training. In a case like this, that the fault lies with management. re not adequately trained for the job, or al factor (noise, temperature, lighting, or at fault, or the operators may simply not e task (because of vision impairment, im- or some other problem). In any of those ment is at fault and, therefore, should do ming to correct the problem. an be valuable tools for converting data into ase information. The key is teaching opera- them and empowering them to do so. O-2 Good or bad 11 B1 Pass or fail Accept or reject o-1 13 Al . Conforming or nonconforming A.1 0-2 4 Variables Data 28 C2 23 . Measured values (dimension, weight, voltage, surface, etc.) --- --- - ::::: 33 C3 36 Figure 15.14 would tell us what we wanted to know if we were interested only in the number of shafts accepted versus the number rejected. Looking at the shaft process in this way, we are using attributes data: either they passed or they failed the screening. This reveals only that we are scrap- ping between 3 and 4% of all the shafts made. It does not tell us anything about the process adjustment that may be contributing to the scrap rate. Nor does it tell us anything about how robust the process is-might some slight change push the process over the edge? For that kind of insight, we need variables data. One can gain much more information about a pro- cess when variables data are available. The check sheet of O.1 .1 3 +-1 40 82 Half-day totals 10 79 6 4 76 6 10 9 39 35 17 15 11 Full-day totals 12 19 74 LEGEND: Hand wrap . Solder point to point A= Harness Ribbon Other FIGURE 15.13 Check Sheet: Defect Factors-Miswires. HISTOGRAMS measured data. That example used shaft length measured in thousandths of an inch, but any scale of measurement can be Figure 15.12 shows that both of the rejects (out-of-limits used, as appropriate for the process under scrutiny. A pro- tise Not Required shafts) were on the low side of the specified tolerance. The although much of the following discussion control charts is related to statistics, many will not be expert statisticians, Unfortunately, ext does not allow for a treatise on statistics, oted to present the material and mathemati- way that can be followed by the uninitiated stay with us. In doing this, we have sacri- e accuracy of the information presented or plied. Our objective is that both the statistics ert will be rewarded with a good understand- their applications, and the methodology and math. For those interested in delving deeper tatistics, many books are dedicated to each Histograms are used to chart frequency of occurrence. How often does something happen? Any discussion of histograms must begin with an understanding of the two kinds of data cess used in making electrical resistors would use the scale peak of the histogram seems to occur between 1.123 and commonly associated with processes: attributes and variables a weight scale, and so on. Variables data are something that data. Although they were not introduced as such, both kinds of data have been used in the illustrations of this chapter. An attribute is something that the output product of the pro- cess either has or does not have. From one of the examples Go-No Go screen at the end of the process, accepting all (Figure 15.6), either an electronic assembly had wiring er- rors or it did not. Another example (see Figure 15.30) shows that either an assembly had broken screws or it did not. These are attributes. The example of making shafts of a spec- ified length (Figures 15.11 and 15.12) was concerned with 1.124 in. If the machine were adjusted to bring the peak up to 1.125 in., some of the low-end rejects might be elimi- nated without causing any new rejects at the top end. The frequency distribution also suggests that the process as it stands now will always have occasional rejects-probably in the 2 to 3% range at best. of electrical resistance in ohms, another process might use results from measurement. Using the shaft example again, an all-too-common sce- nario in manufacturing plants would have been to place a shafts between the specification limits of 1.120 and 1.130 in. and discarding the rest. Data might have been i keep track of the number of shafts that had to be scrapped. Such a record might have looked like Figure 15.14, based on the original data. to Shaft Acceptance: Week of 7/11 (Spec: 1.120-1.130) Date Accepted Rejected 11. 12. 13. 14. 15. 11 12 11 12 12 Totals 58
on't know the cause at this point, but we t looking. these two people might very well have red. In a total quality setting, that deci- sidered the last resort. Most employees job and will if they are provided with urces and training. In a case like this, that the fault lies with management. re not adequately trained for the job, or al factor (noise, temperature, lighting, or at fault, or the operators may simply not e task (because of vision impairment, im- or some other problem). In any of those ment is at fault and, therefore, should do ming to correct the problem. an be valuable tools for converting data into ase information. The key is teaching opera- them and empowering them to do so. O-2 Good or bad 11 B1 Pass or fail Accept or reject o-1 13 Al . Conforming or nonconforming A.1 0-2 4 Variables Data 28 C2 23 . Measured values (dimension, weight, voltage, surface, etc.) --- --- - ::::: 33 C3 36 Figure 15.14 would tell us what we wanted to know if we were interested only in the number of shafts accepted versus the number rejected. Looking at the shaft process in this way, we are using attributes data: either they passed or they failed the screening. This reveals only that we are scrap- ping between 3 and 4% of all the shafts made. It does not tell us anything about the process adjustment that may be contributing to the scrap rate. Nor does it tell us anything about how robust the process is-might some slight change push the process over the edge? For that kind of insight, we need variables data. One can gain much more information about a pro- cess when variables data are available. The check sheet of O.1 .1 3 +-1 40 82 Half-day totals 10 79 6 4 76 6 10 9 39 35 17 15 11 Full-day totals 12 19 74 LEGEND: Hand wrap . Solder point to point A= Harness Ribbon Other FIGURE 15.13 Check Sheet: Defect Factors-Miswires. HISTOGRAMS measured data. That example used shaft length measured in thousandths of an inch, but any scale of measurement can be Figure 15.12 shows that both of the rejects (out-of-limits used, as appropriate for the process under scrutiny. A pro- tise Not Required shafts) were on the low side of the specified tolerance. The although much of the following discussion control charts is related to statistics, many will not be expert statisticians, Unfortunately, ext does not allow for a treatise on statistics, oted to present the material and mathemati- way that can be followed by the uninitiated stay with us. In doing this, we have sacri- e accuracy of the information presented or plied. Our objective is that both the statistics ert will be rewarded with a good understand- their applications, and the methodology and math. For those interested in delving deeper tatistics, many books are dedicated to each Histograms are used to chart frequency of occurrence. How often does something happen? Any discussion of histograms must begin with an understanding of the two kinds of data cess used in making electrical resistors would use the scale peak of the histogram seems to occur between 1.123 and commonly associated with processes: attributes and variables a weight scale, and so on. Variables data are something that data. Although they were not introduced as such, both kinds of data have been used in the illustrations of this chapter. An attribute is something that the output product of the pro- cess either has or does not have. From one of the examples Go-No Go screen at the end of the process, accepting all (Figure 15.6), either an electronic assembly had wiring er- rors or it did not. Another example (see Figure 15.30) shows that either an assembly had broken screws or it did not. These are attributes. The example of making shafts of a spec- ified length (Figures 15.11 and 15.12) was concerned with 1.124 in. If the machine were adjusted to bring the peak up to 1.125 in., some of the low-end rejects might be elimi- nated without causing any new rejects at the top end. The frequency distribution also suggests that the process as it stands now will always have occasional rejects-probably in the 2 to 3% range at best. of electrical resistance in ohms, another process might use results from measurement. Using the shaft example again, an all-too-common sce- nario in manufacturing plants would have been to place a shafts between the specification limits of 1.120 and 1.130 in. and discarding the rest. Data might have been i keep track of the number of shafts that had to be scrapped. Such a record might have looked like Figure 15.14, based on the original data. to Shaft Acceptance: Week of 7/11 (Spec: 1.120-1.130) Date Accepted Rejected 11. 12. 13. 14. 15. 11 12 11 12 12 Totals 58

Linear Algebra: A Modern Introduction
4th Edition
ISBN:9781285463247
Author:David Poole
Publisher:David Poole
Chapter2: Systems Of Linear Equations
Section2.4: Applications
Problem 28EQ

Related questions
Question
Read the pages and make a summary of them with your own words, please. It is what you understand.
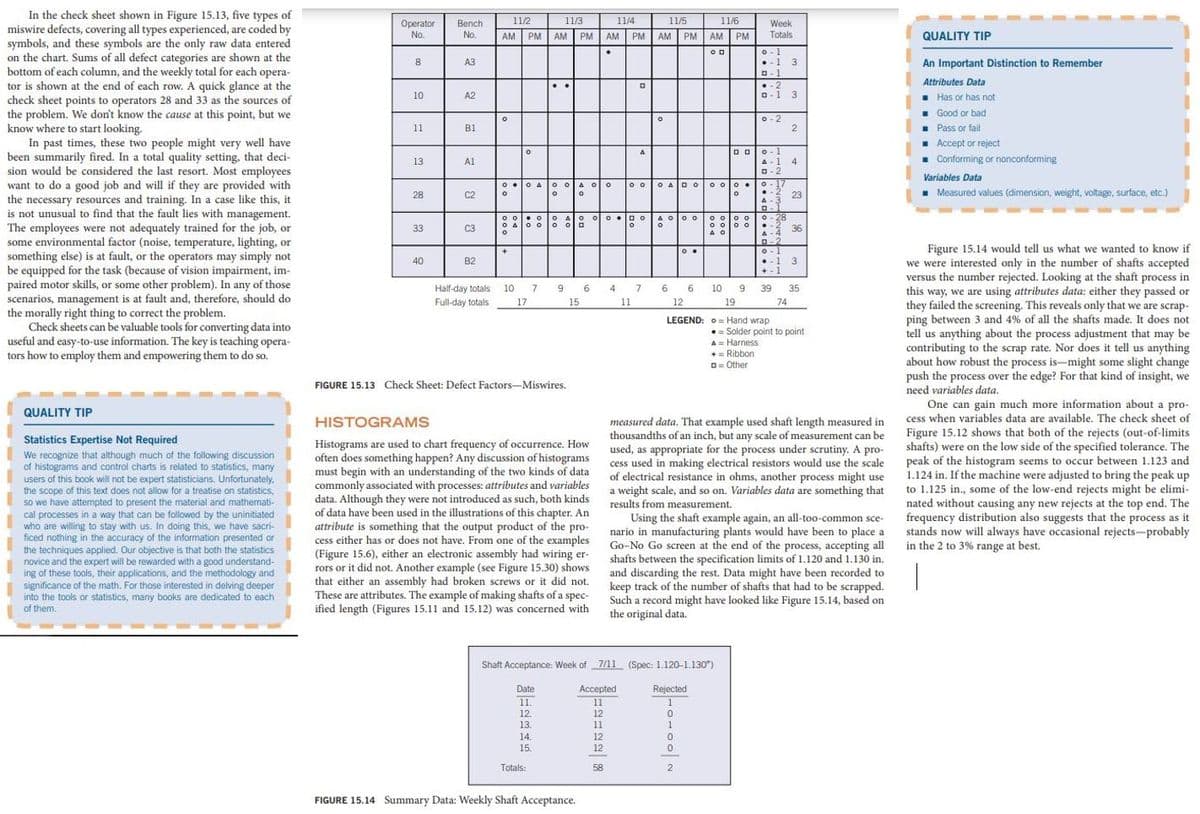
Transcribed Image Text:In the check sheet shown in Figure 15.13, five types of
miswire defects, covering all types experienced, are coded by
symbols, and these symbols are the only raw data entered
on the chart. Sums of all defect categories are shown at the
bottom of each column, and the weekly total for each opera-
tor is shown at the end of each row. A quick glance at the
check sheet points to operators 28 and 33 as the sources of
the problem. We don't know the cause at this point, but we
know where to start looking.
In past times, these two people might very well have
been summarily fired. In a total quality setting, that deci-
sion would be considered the last resort. Most employees
want to do a good job and will if they are provided with
the necessary resources and training. In a case like this, it
is not unusual to find that the fault lies with management.
The employees were not adequately trained for the job, or
some environmental factor (noise, temperature, lighting, or
something else) is at fault, or the operators may simply not
be equipped for the task (because of vision impairment, im-
paired motor skills, or some other problem). In any of those
scenarios, management is at fault and, therefore, should do
the morally right thing to correct the problem.
Check sheets can be valuable tools for converting data into
useful and easy-to-use information. The key is teaching opera-
tors how to employ them and empowering them to do so.
11/2
11/3
11/4
11/5
11/6
Operator
No.
Bench
No.
Week
.
AM PM AM | PM | AM PM | AM PM | AM PM
АМ
Totals
QUALITY TIP
o- 1
•-1 3
O-1
A3
An Important Distinction to Remember
•.2
Attributes Data
..
- Has or has not
- Good or bad
10
A2
O-1
3
o-2
. Pass or fail
. Accept or reject
- Conforming or nonconforming
11
BI
O-1
A-1
4
O-2
13
Al
Variables Data
0 •O A o oA oo
o o
O AD O
ooo.
O- 17
28
C2
23
A-3
Measured values (dimension, weight, voltage, surface, etc.)
o- 28
.-2
•* 36
A-4
A O
O Aoo
o o
33
C3
A O
D-2
O-1
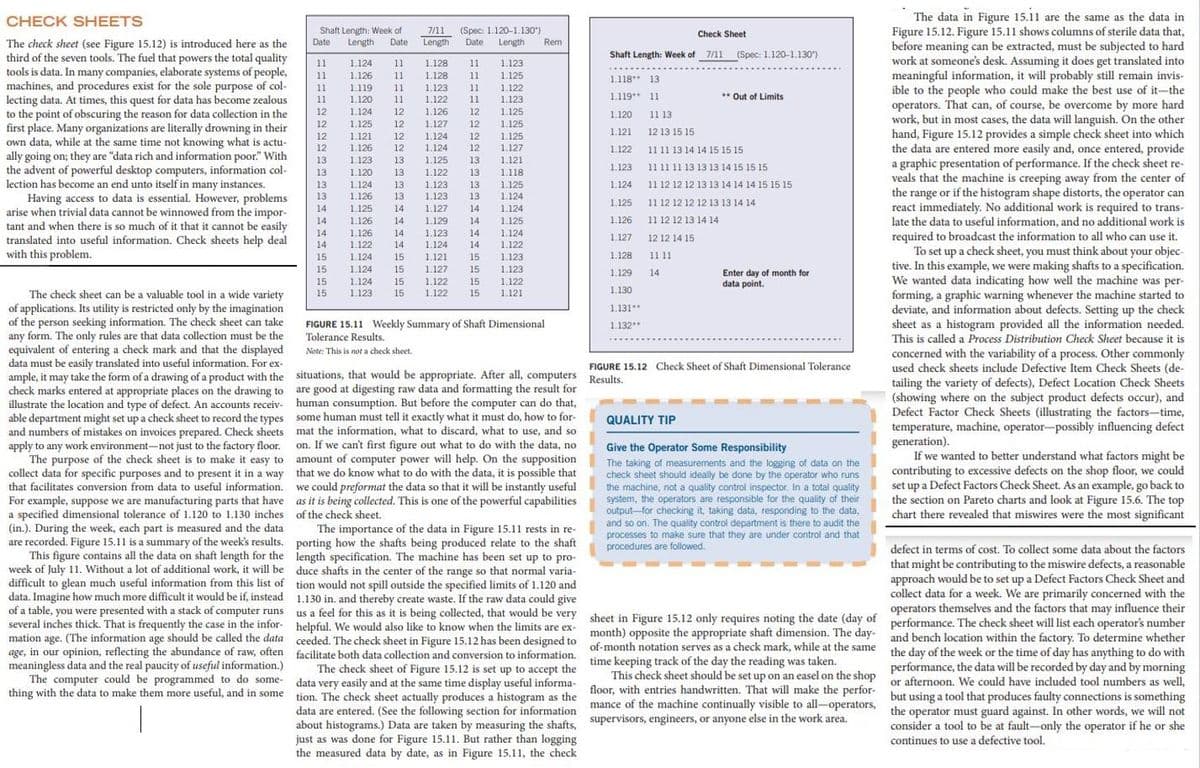
Figure 15.14 would tell us what we wanted to know if
we were interested only in the number of shafts accepted
versus the number rejected. Looking at the shaft process in
this way, we are using attributes data: either they passed or
they failed the screening. This reveals only that we are scrap-
ping between 3 and 4% of all the shafts made, It does not
tell us anything about the process adjustment that may be
contributing to the scrap rate. Nor does it tell us anything
about how robust the process is-might some slight change
push the process over the edge? For that kind of insight, we
need variables data.
40
B2
+-1
Half-day totals 10 7
9 6 4 7 6 6 10 9 39
35
Full-day totals
17
15 11
12
19
74
LEGEND: 0= Hand wrap
Solder point to point
A= Harness
+= Ribbon
O= Other
FIGURE 15.13 Check Sheet: Defect Factors-Miswires.
One can gain much more information about a pro-
QUALITY TIP
HISTOGRAMS
cess when variables data are available. The check sheet of
measured data. That example used shaft length measured in
thousandths of an inch, but any scale of measurement can be
used, as appropriate for the process under scrutiny. A pro-
cess used in making electrical resistors would use the scale
of electrical resistance in ohms, another process might use
weight scale, and so on. Variables data are something that
results from measurement.
Figure 15.12 shows that both of the rejects (out-of-limits
shafts) were on the low side of the specified tolerance. The
peak of the histogram seems to occur between 1.123 and
1.124 in. If the machine were adjusted to bring the peak up
to 1.125 in., some of the low-end rejects might be elimi-
nated without causing any new rejects at the top end. The
frequency distribution also suggests that the process as it
stands now will always have occasional rejects-probably
in the 2 to 3% range at best.
Statistics Expertise Not Required
We recognize that although much of the following discussion
of histograms and control charts is related to statistics, many
users of this book will not be expert statisticians. Unfortunately,
the scope of this text does not allow for a treatise on statistics,
so we have attempted to present the material and mathemati-
Histograms are used to chart frequency of occurrence. How
often does something happen? Any discussion of histograms
must begin with an understanding of the two kinds of data
commonly associated with processes: attributes and variables
data. Although they were not introduced as such, both kinds
of data have been used in the illustrations of this chapter. An
cal processes in a way that can be followed by the uninitiated
who are willing to stay with us. In doing this, we have sacri-
ficed nothing in the accuracy of the information presented or
the techniques applied. Our objective is that both the statistics
novice and the expert will be rewarded with a good understand-
ing of these tools, their applications, and the methodology and
significance of the math. For those interested in delving deeper
into the tools or statistics, many books are dedicated to each
of them.
Using the shaft example again, an all-too-common sce-
nario in manufacturing plants would have been to place a
Go-No Go screen at the end of the process, accepting all
shafts between the specification limits of 1.120 and 1.130 in.
and discarding the rest. Data might have been recorded to
keep track of the number of shafts that had to be scrapped.
Such a record might have looked like Figure 15.14, based on
the original data.
attribute is something that the output product of the
cr pro-
cess either has or does not have. From one of the examples
(Figure 15.6), either an electronic assembly had wiring er-
rors or it did not. Another example (see Figure 15.30) shows
that either an assembly had broken screws or it did not.
These are attributes. The example of making shafts of a spec-
ified length (Figures 15.11 and 15.12) was concerned with
Shaft Acceptance: Week of 7/11 (Spec: 1.120-1.130")
Date
Accepted
11
Rejected
1.
1
12.
13.
12
11
14.
12
15.
12
Totals:
58
FIGURE 15.14 Summary Data: Weekly Shaft Acceptance.
Transcribed Image Text:The data in Figure 15.11 are the same as the data in
Figure 15.12. Figure 15.11 shows columns of sterile data that,
before meaning can be extracted, must be subjected to hard
work at someone's desk. Assuming it does get translated into
meaningful information, it will probably still remain invis-
ible to the people who could make the best use of it-the
operators. That can, of course, be overcome by more hard
work, but in most cases, the data will languish. On the other
hand, Figure 15.12 provides a simple check sheet into which
the data are entered more easily and, once entered, provide
a graphic presentation of performance. If the check sheet re-
veals that the machine is creeping away from the center of
the range or if the histogram shape distorts, the operator can
react immediately. No additional work is required to trans-
late the data to useful information, and no additional work is
CHECK SHEETS
Shaft Length: Week of
Length
7/11
(Spec: 1.120-1.130)
Check Sheet
Date
Date
Length
Date
Rem
The check sheet (see Figure 15.12) is introduced here as the
third of the seven tools. The fuel that powers the total quality
tools is data. In many companies, elaborate systems of people,
machines, and procedures exist for the sole purpose of col-
lecting data. At times, this quest for data has become zealous
to the point of obscuring the reason for data collection in the
first place. Many organizations are literally drowning in their
own data, while at the same time not knowing what is actu-
ally going on; they are "data rich and information poor." With
the advent of powerful desktop computers, information col-
lection has become an end unto itself in many instances.
Having access to data is essential. However, problems
arise when trivial data cannot be winnowed from the impor-
tant and when there is so much of it that it cannot be easily
translated into useful information. Check sheets help deal
with this problem.
Length
Shaft Length: Week of 7/11 (Spec: 1.120-1.130")
11
1.124
11
1.128
11
1.123
.....
11
1.126
11
1.128
11
1.125
1.118* 13
11
1.119
11
1.123
11
1.122
1.123
11
1.120
11
1.122
11
1,119** 11
** Out of Limits
12
1.124
12
1.126
12
1.125
1.120
11 13
12
1.125
12
1.127
12
1.125
1.121
12 13 15 15
12
1.121
1.126
12
1.124
12
1.125
12
12
1.124
12
1.127
1.122
11 11 13 14 14 15 15 15
1.123
1.120
13
13
1.125
13
1.121
1.123
11 11 11 13 13 13 14 15 15 15
13
13
1.122
13
1.118
13
1.124
13
1.123
13
1.125
1.124
11 12 12 12 13 13 14 14 14 15 15 15
13
1.126
13
1.123
13
1.124
1.125
11 12 12 12 12 13 13 14 14
14
1.125
14
1.127
14
1.124
14
1.126
14
1.129
14
1.125
1.126
11 12 12 13 14 14
14
1.126
14
1.123
14
1.124
required to broadcast the information to all who can use it.
To set up a check sheet, you must think about your objec-
tive. In this example, we were making shafts to a specification.
We wanted data indicating how well the machine was per-
forming, a graphic warning whenever the machine started to
deviate, and information about defects. Setting up the check
sheet as a histogram provided all the information needed.
This is called a Process Distribution Check Sheet because it is
1.127
12 12 14 15
14
1.122
14
1.124
14
1.122
15
1.124
15
1.121
15
1.123
1.128
11 11
15
1.124
15
1.127
15
1.123
Enter day of month for
data point.
1.129
14
1.124
1.123
15
15
1.122
15
1.122
15
15
1.122
15
1.121
1.130
The check sheet can be a valuable tool in a wide variety
of applications. Its utility is restricted only by the imagination
of the person seeking information. The check sheet can take
any form. The only rules are that data collection must be the
equivalent of entering a check mark and that the displayed
data must be easily translated into useful information. For ex-
ample, it may take the form of a drawing of a product with the situations, that would be appropriate. After all, computers Results.
check marks entered at appropriate places on the drawing to are good at digesting raw data and formatting the result for
illustrate the location and type of defect. An accounts receiv- human consumption. But before the computer can do that,
able department might set up a check sheet to record the types some human must tell it exactly what it must do, how to for-
and numbers of mistakes on invoices prepared. Check sheets mat the information, what to discard, what to use, and so
apply to any work environment-not just to the factory floor. on. If we can't first figure out what to do with the data, no
The purpose of the check sheet is to make it easy to amount of computer power will help. On the supposition
collect data for specific purposes and to present it in a way that we do know what to do with the data, it is possible that
that facilitates conversion from data to useful information. we could preformat the data so that it will be instantly useful
example, suppose we are manufacturing parts that have as it is being collected. This is one of the powerful capabilities
a specified dimensional tolerance of 1.120 to 1.130 inches of the check sheet.
(in.). During the week, each part is measured and the data
are recorded. Figure 15.11 is a summary of the week's results. porting how the shafts being produced relate to the shaft
This figure contains all the data on shaft length for the length specification. The machine has been set up to pro-
week of July 11. Without a lot of additional work, it will be duce shafts in the center of the range so that normal varia-
difficult to glean much useful information from this list of tion would not spill outside the specified limits of 1.120 and
data, Imagine how much more difficult it would be if, instead 1.130 in, and thereby create waste. If the raw data could give
of a table, you were presented with a stack of computer runs us a feel for this as it is being collected, that would be very sheet in Figure 15.12 only requires noting the date (day of performance. The check sheet will list each operator's number
several inches thick. That is frequently the case in the infor- helpful. We would also like to know when the limits are ex- month) opposite the appropriate shaft dimension. The day- and bench location within the factory. To determine whether
mation age. (The information age should be called the data ceeded. The check sheet in Figure 15.12 has been designed to of-month notation serves as a check mark, while at the same the day of the week or the time of day has anything to do with
age, in our opinion, reflecting the abundance of raw, often facilitate both data collection and conversion to information. time keeping track of the day the reading was taken.
meaningless data and the real paucity of useful information.)
The computer could be programmed to do some- data very easily and at the same time display useful informa- floor, with entries handwritten. That will make the perfor- but using a tool that produces faulty connections is something
thing with the data to make them more useful, and in some tion. The check sheet actually produces a histogram as the mance of the machine continually visible to all-operators, the operator must guard against. In other words, we will not
1.131**
FIGURE 15.11 Weekly Summary of Shaft Dimensional
Tolerance Results.
1.132**
Note: This is not a check sheet.
concerned with the variability of a process. Other commonly
used check sheets include Defective Item Check Sheets (de-
tailing the variety of defects), Defect Location Check Sheets
(showing where on the subject product defects occur), and
Defect Factor Check Sheets (illustrating the factors-time,
temperature, machine, operator-possibly influencing defect
generation).
If we wanted to better understand what factors might be
FIGURE 15.12 Check Sheet of Shaft Dimensional Tolerance
QUALITY TIP
Give the Operator Some Responsibility
The taking of measurements and the logging of data on the
check sheet should ideally be done by the operator who runs
the machine, not a quality control inspector. In a total quality
system, the operators are responsible for the quality of their
output-for checking it, taking data, responding to the data,
and so on. The quality control department is there to audit the
processes to make sure that they are under control and that
procedures are followed.
contributing to excessive defects on the shop floor, we could
set up a Defect Factors Check Sheet. As an example, go back to
the section on Pareto charts and look at Figure 15.6. The top
chart there revealed that miswires were the most significant
Tation.
For
The importance of the data in Figure 15.11 rests in re-
defect in terms of cost. To collect some data about the factors
that might be contributing to the miswire defects, a reasonable
approach would be to set up a Defect Factors Check Sheet and
collect data for a week. We are primarily concerned with the
operators themselves and the factors that may influence their
The check sheet of Figure 15.12 is set up to accept the
This check sheet should be set up on an easel on the shop performance, the data will be recorded by day and by morning
data are entered. (See the following section for information
about histograms.) Data are taken by measuring the shafts, supervisors, engineers, or anyone else in the work area.
just as was done for Figure 15.11. But rather than logging
the measured data by date, as in Figure 15.11, the check
consider a tool to be at fault-only the operator if he or she
continues to use a defective tool.
Expert Solution
This question has been solved!
Explore an expertly crafted, step-by-step solution for a thorough understanding of key concepts.

This is a popular solution!

Trending now
This is a popular solution!

Step by step
Solved in 2 steps with 1 images

Recommended textbooks for you
Linear Algebra: A Modern Introduction
Algebra
ISBN:
9781285463247
Author:
David Poole
Publisher:
Cengage Learning

Algebra & Trigonometry with Analytic Geometry
Algebra
ISBN:
9781133382119
Author:
Swokowski
Publisher:
Cengage

Trigonometry (MindTap Course List)
Trigonometry
ISBN:
9781337278461
Author:
Ron Larson
Publisher:
Cengage Learning
Linear Algebra: A Modern Introduction
Algebra
ISBN:
9781285463247
Author:
David Poole
Publisher:
Cengage Learning
Algebra & Trigonometry with Analytic Geometry
Algebra
ISBN:
9781133382119
Author:
Swokowski
Publisher:
Cengage
Trigonometry (MindTap Course List)
Trigonometry
ISBN:
9781337278461
Author:
Ron Larson
Publisher:
Cengage Learning