You are a process engineer for a company that manufactures widgets. A particular machine at your company used to have some downtime during the day on 35.9% of days. You decided to make some changes to how the machine is calibrated in an attempt to reduce downtime. After monitoring the machine for 180 days after your changes were implemented, you find that the machine had some downtime during the day on 30.4% of days. Conduct a hypothesis test to determine if the proportion of days that the machine has downtime has decreased from before, with a= 0.01. Using this information, what is the test statistic in your analysis? Only round your final answer and choose the closest choice to your answer. -1.54 O-1.60 1.38 O-1.66 O-2.33
You are a process engineer for a company that manufactures widgets. A particular machine at your company used to have some downtime during the day on 35.9% of days. You decided to make some changes to how the machine is calibrated in an attempt to reduce downtime. After monitoring the machine for 180 days after your changes were implemented, you find that the machine had some downtime during the day on 30.4% of days. Conduct a hypothesis test to determine if the proportion of days that the machine has downtime has decreased from before, with a= 0.01. Using this information, what is the test statistic in your analysis? Only round your final answer and choose the closest choice to your answer. -1.54 O-1.60 1.38 O-1.66 O-2.33

Chapter9: Sequences, Probability And Counting Theory
Section9.7: Probability
Problem 3SE: What is an experiment?

Related questions
Question
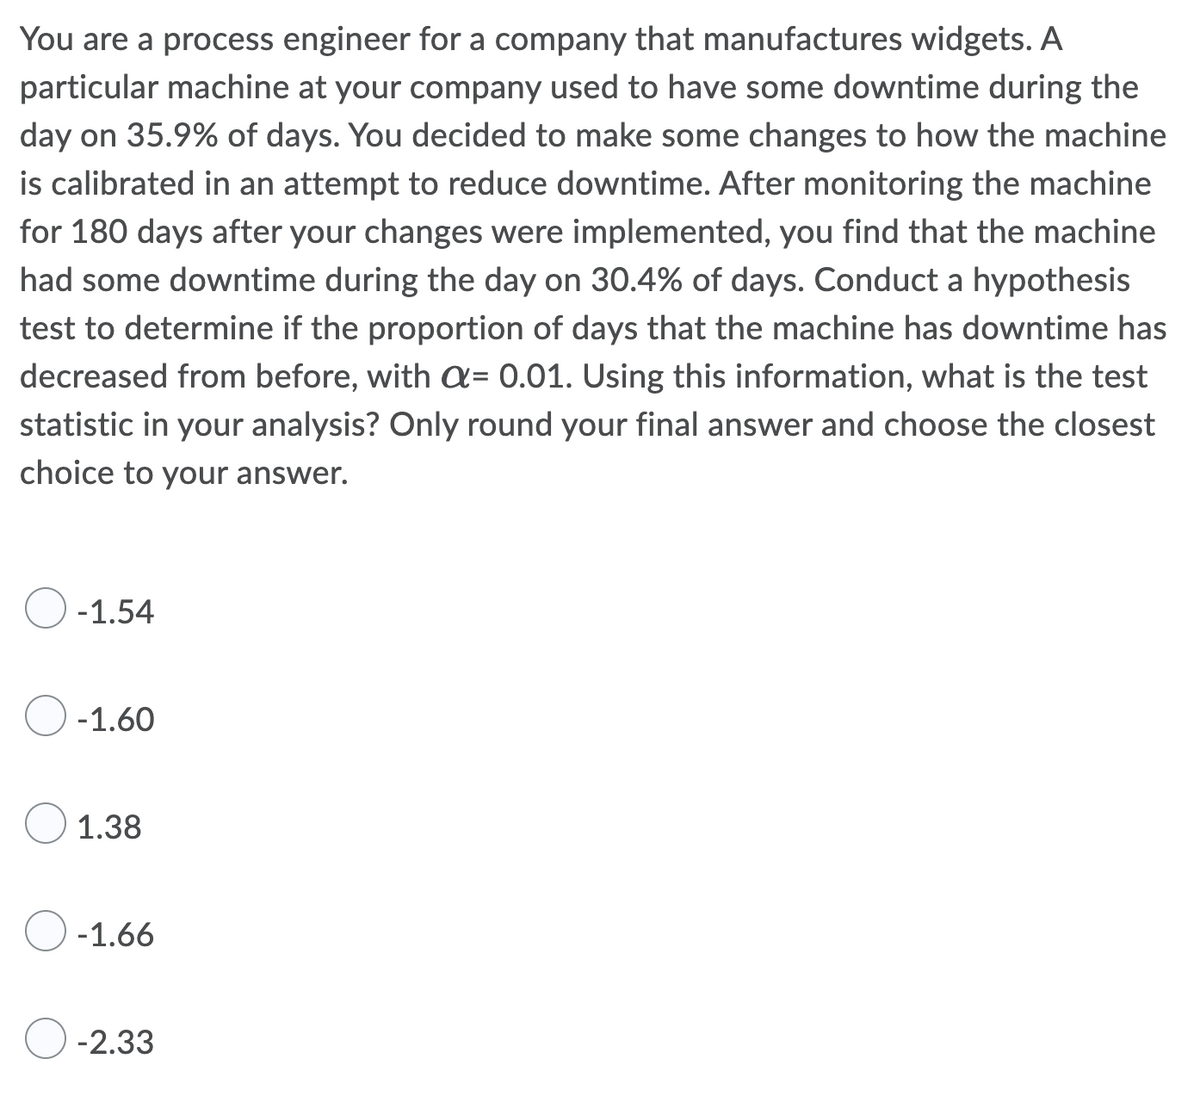
Transcribed Image Text:You are a process engineer for a company that manufactures widgets. A
particular machine at your company used to have some downtime during the
day on 35.9% of days. You decided to make some changes to how the machine
is calibrated in an attempt to reduce downtime. After monitoring the machine
for 180 days after your changes were implemented, you find that the machine
had some downtime during the day on 30.4% of days. Conduct a hypothesis
test to determine if the proportion of days that the machine has downtime has
decreased from before, with a= 0.01. Using this information, what is the test
statistic in your analysis? Only round your final answer and choose the closest
choice to your answer.
-1.54
-1.60
1.38
-1.66
-2.33
Expert Solution
This question has been solved!
Explore an expertly crafted, step-by-step solution for a thorough understanding of key concepts.

Step by step
Solved in 2 steps with 2 images

Recommended textbooks for you