OPEC deadlocked on oil production hike Price (dollars per barrel) 120- Oil prices exceeded $100-a-barrel Wednesday after OPEC said it could not reach an agreement about increasing crude oil production. 115- Source: CNN Money, June 8, 2011 110- Use the demand and supply model to illustrate OPEC's deadlock. 105- 100- Consider the market for oil. 95- Draw demand and supply curves consistent with the oil price exceeding $100 a barrel. Label the curves Do and So. 90- Draw a point at the market equilibrium price. Label it 1. 85- Now suppose that OPEC members agree to increase oil production. 80+ 100 110 120 130 140 150 160 170 Draw a curve to show the effect of this agreement in the market for oil. Label Quantity (millions of barrels per day) it. >>> Draw only the objects specified in the question. Draw a point at the new market equilibrium. Label it 2.
OPEC deadlocked on oil production hike Price (dollars per barrel) 120- Oil prices exceeded $100-a-barrel Wednesday after OPEC said it could not reach an agreement about increasing crude oil production. 115- Source: CNN Money, June 8, 2011 110- Use the demand and supply model to illustrate OPEC's deadlock. 105- 100- Consider the market for oil. 95- Draw demand and supply curves consistent with the oil price exceeding $100 a barrel. Label the curves Do and So. 90- Draw a point at the market equilibrium price. Label it 1. 85- Now suppose that OPEC members agree to increase oil production. 80+ 100 110 120 130 140 150 160 170 Draw a curve to show the effect of this agreement in the market for oil. Label Quantity (millions of barrels per day) it. >>> Draw only the objects specified in the question. Draw a point at the new market equilibrium. Label it 2.

Microeconomics A Contemporary Intro
10th Edition
ISBN:9781285635101
Author:MCEACHERN
Publisher:MCEACHERN
Chapter4: Demand, Supply, And Markets
Section: Chapter Questions
Problem 21PAE

Related questions
Question
Transcribed Image Text:OPEC deadlocked on oil production hike
Price (dollars per barrel)
120-
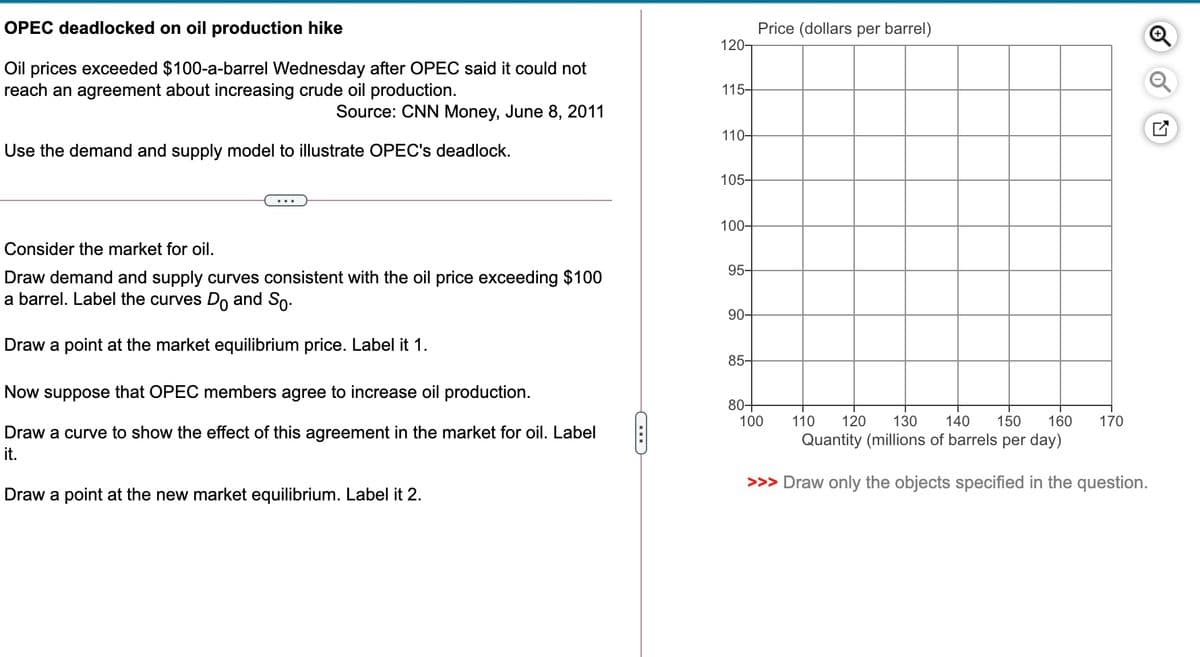
Oil prices exceeded $100-a-barrel Wednesday after OPEC said it could not
reach an agreement about increasing crude oil production.
115-
Source: CNN Money, June 8, 2011
110-
Use the demand and supply model to illustrate OPEC's deadlock.
105-
100-
Consider the market for oil.
95-
Draw demand and supply curves consistent with the oil price exceeding $100
a barrel. Label the curves Do and So.
90-
Draw a point at the market equilibrium price. Label it 1.
85-
Now suppose that OPEC members agree to increase oil production.
80-
100
110
120
130
140
150
160
170
Draw a curve to show the effect of this agreement in the market for oil. Label
Quantity (millions of barrels per day)
it.
>>> Draw only the objects specified in the question.
Draw a point at the new market equilibrium. Label it 2.
Expert Solution
This question has been solved!
Explore an expertly crafted, step-by-step solution for a thorough understanding of key concepts.

This is a popular solution!

Trending now
This is a popular solution!

Step by step
Solved in 3 steps with 2 images

Knowledge Booster


Learn more about
Need a deep-dive on the concept behind this application? Look no further. Learn more about this topic, economics and related others by exploring similar questions and additional content below.Recommended textbooks for you

Principles of Economics 2e
Economics
ISBN:
9781947172364
Author:
Steven A. Greenlaw; David Shapiro
Publisher:
OpenStax
Principles of Economics 2e
Economics
ISBN:
9781947172364
Author:
Steven A. Greenlaw; David Shapiro
Publisher:
OpenStax