Open et up the ANOVA table for this problem. Show the entries to 2 decimals, if necessary. spreadsheet Source of Variation Sum of Squares Degrees of Freedom Mean Square Treatments Blocks Error Total Calculate the value of the test statistic (to 2 decimals). Calculate the critical value (to 2 decimals). Calculate the p-value (to 4 decimals). eject null hypothesis? © What is your conclusion? 110 F Adaptive Test P
Open et up the ANOVA table for this problem. Show the entries to 2 decimals, if necessary. spreadsheet Source of Variation Sum of Squares Degrees of Freedom Mean Square Treatments Blocks Error Total Calculate the value of the test statistic (to 2 decimals). Calculate the critical value (to 2 decimals). Calculate the p-value (to 4 decimals). eject null hypothesis? © What is your conclusion? 110 F Adaptive Test P

Glencoe Algebra 1, Student Edition, 9780079039897, 0079039898, 2018
18th Edition
ISBN:9780079039897
Author:Carter
Publisher:Carter
Chapter10: Statistics
Section10.5: Comparing Sets Of Data
Problem 3BGP

Related questions
Question
100%
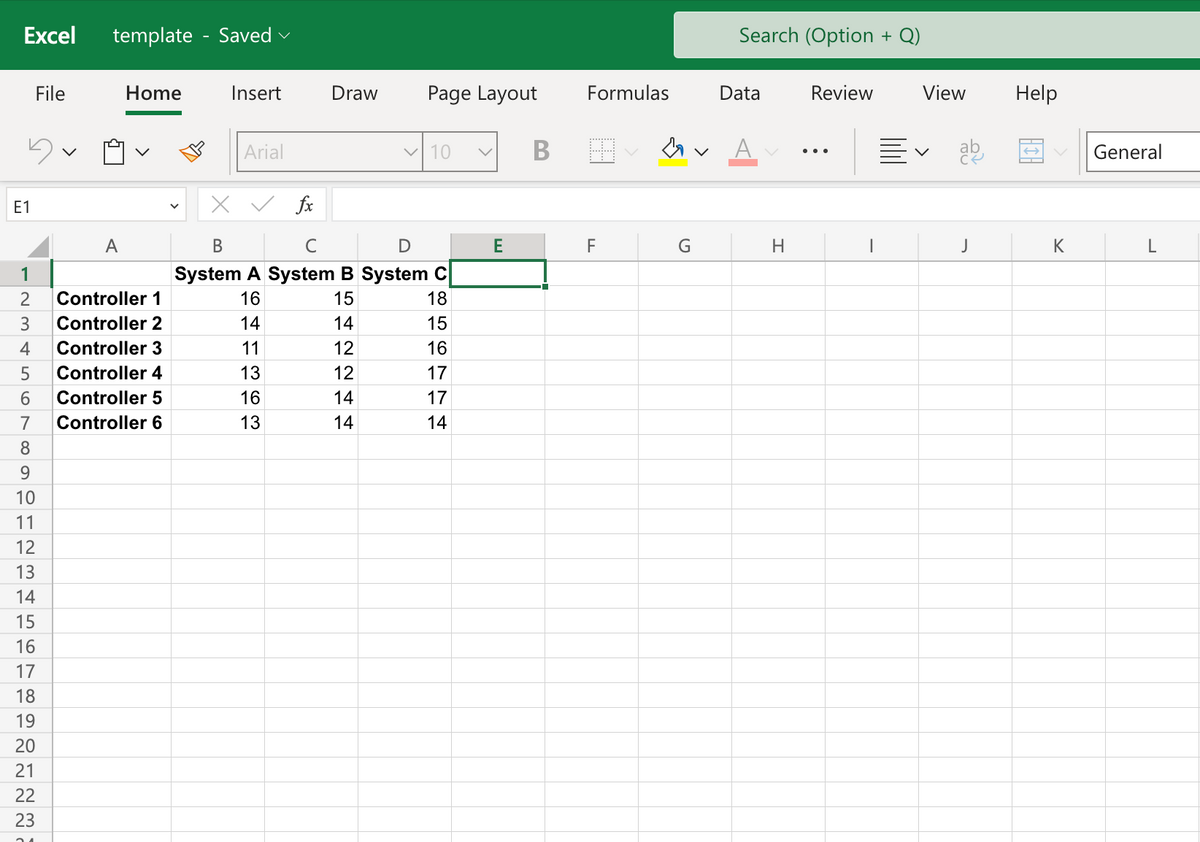
A study measuring the fatigue of air traffic controllers resulted in proposals for modficiation and redesign of the controllers' workstation. After consideration of several designs for the workstation, three specific alternatives are selected as having the best potential for reducing controller stress. The key question is: To what extent do the three alternatives differ in terms of their effect on controller stress?
A randomized block design is used to test the hypothesis of no difference in stress levels for the three workstation alternatives. The data for the experiment is located in the Microsoft Excel Online file below. Use ? = 0.05 to test for any significant differences.
Transcribed Image Text:Open spreadsheet
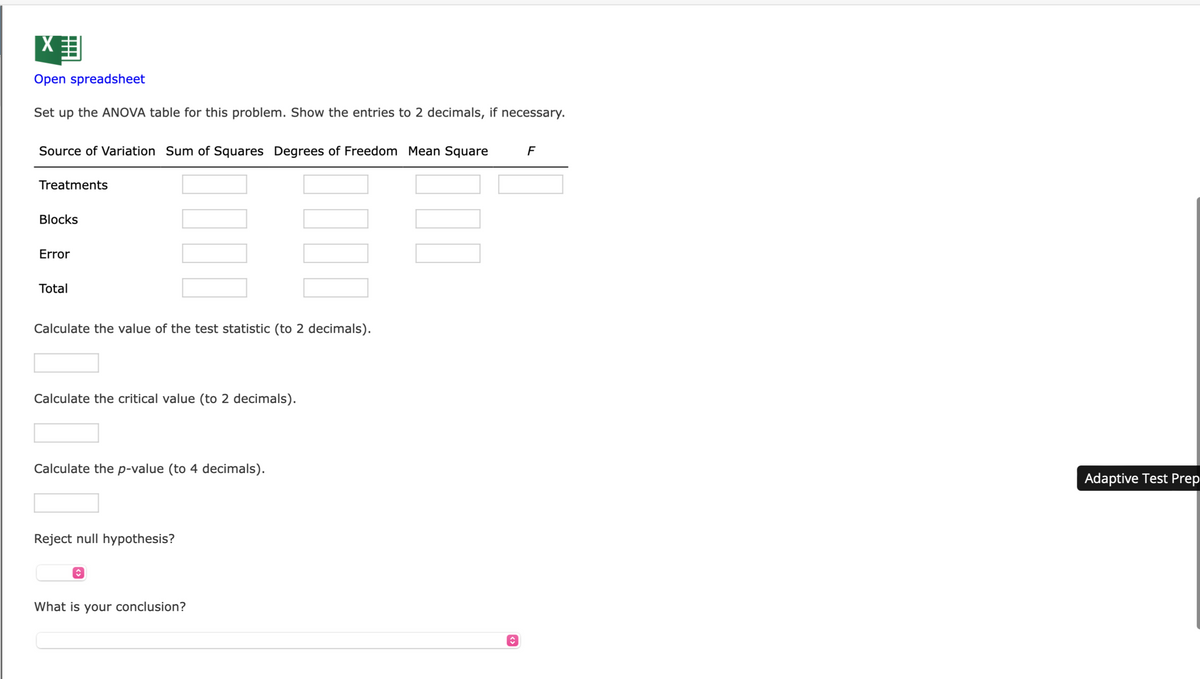
Set up the ANOVA table for this problem. Show the entries to 2 decimals, if necessary.
Source of Variation Sum of Squares Degrees of Freedom Mean Square
Treatments
Blocks
Error
Total
Calculate the value of the test statistic (to 2 decimals).
Calculate the critical value (to 2 decimals).
Calculate the p-value (to 4 decimals).
Reject null hypothesis?
What is your conclusion?
ŵ
F
Adaptive Test Prep
Transcribed Image Text:Excel template - Saved ✓
E1
1
23456789
File
10
11
12
13
14
15
16
17
18
19
20
21
22
23
Home
Ú
A
Controller 1
Controller 2
Controller 3
Controller 4
Controller 5
Controller 6
Insert
Arial
Draw
14
fx
B
с
D
System A System B System C
16
15
14
11
13
16
13
2244
12
12
14
Page Layout
14
✓10
기니니이이잉ㅇ
18
15
16
17
17
14
E
B
Formulas
F
M.
G
Search (Option + Q)
Data
H
Review
View
V
J
Help
K
General
L
Expert Solution
This question has been solved!
Explore an expertly crafted, step-by-step solution for a thorough understanding of key concepts.

Step by step
Solved in 3 steps with 17 images

Recommended textbooks for you
Glencoe Algebra 1, Student Edition, 9780079039897…
Algebra
ISBN:
9780079039897
Author:
Carter
Publisher:
McGraw Hill
Glencoe Algebra 1, Student Edition, 9780079039897…
Algebra
ISBN:
9780079039897
Author:
Carter
Publisher:
McGraw Hill