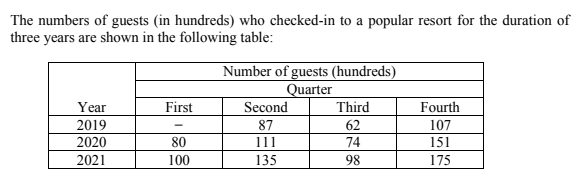
The numbers of guests (in hundreds) who checked-in to a popular resort for the duration of three years are shown in the following table: Year 2019 2020 2021 First 80 100 Number of guests (hundreds) Quarter Second 87 111 135 Third 62 74 98 Fourth 107 151 175


Q: The normal quantile plot shown to the right represents duration times (in seconds) of eruptions of…
A: The given normal quantile plot represents the duration times of eruptions of a certain geyser from…
Q: Let X be a continuous rv with the following cdf. F(x) 0 1 x≤0 0 6 [This type of cdf is suggested in…
A: The CDF of X is, FX=0. x≤0x61+ln6x, 0<x≤61, x>6
Q: A case-control study is being planned to see whether proximity to a nuclear power plant is…
A: To answer these questions, we can use the "PROC POWER" procedure in SAS to perform power…
Q: Question 6 "Suppose that in the past, 37% of all adults favored capital punishment. Do we have a…
A: Here From given information Claim : proportion of adult favoring capital punishment is increased .…
Q: Given the contingency table shown here, does the decision to retire appear independent of the…
A: given, the contingency table:- Employee Retire (R) Work (W) Total Management (M) 13 18 31…
Q: You want to obtain a sample to estimate a population proportion. At this point in time, you have no…
A: Sample proportion(p^)=0.5 Margin of error(E)=0.002
Q: Use technology to find the P-value for the hypothesis test described below. The claim is that for a…
A: It is required to obtain the P-value for the given hypothesis test.
Q: A coin-operated coffee machine made by BIG Corporation was designed to discharge a mean of 7.2…
A: A coin-operated coffee machine made by BIG Corporation was designed to discharge a mean of 7.2…
Q: a) Since data were collected for variable(s), the correct graph to make is a . b)…
A: Here dependent variable (y) = Average life expectancy Independent variable (x) = Fertility rate No.…
Q: independent consuffer group stributed with a mean of 700 days and a standard deviation of 121. BIG…
A: V
Q: Let X and Y be two discrete random variables and f(X) and f(Y) be some functions of X and Y…
A: Variables with discrete randomness can have a finite number of different values. A discrete random…
Q: 30 local areas of Victoria were selected from the data provided through the health state website…
A: The question is about correlation test Given : t = 2.5238 df = 28 p-value = 0.01756 CI : (…
Q: Constructing a Frequency Distribution and a Frequency Histogram In Exercises 31–34, construct a…
A: July sales for 21 sales representatives at a company dataset is 2114 2468 7119 1876 4105…
Q: Question 6: A machine fills bottles with 64 ounces of liquid. The quality-control manager determines…
A: The question is about hypo. testing Given : Popl. mean liquid fills the bottle ( μ ) = 64 ounces…
Q: 13) A fair coin is tossed 5 times. Which of the following statements is (are) true? A: The sequence…
A: As per the Bartelby guidelines only one question with three sub-parts can be answered. Kindly…
Q: For table 3, determine the following point estimates: 1. The mathematical expectation. 2. The…
A: As the Bartleby guidelines, only one question with three subparts can be answered. Kindly, repost…
Q: 3 Correct to the nearest 0.1 kg, the masses of five people in a fitness class are 70.8, 68.7, 73.2,…
A: The masses of the five people are given below: Sample size (n) = 5
Q: Say you have a sample of size of n many independent observations X₁, X2,..., Xn from some unknown…
A: We are given that X1 , X2 , X3, ....., Xn are random variables from some unknown distribution and…
Q: The national department of epidemiology has calculated the frequency with which flu patients arrive…
A: The national department of epidemiology has calculated the frequency with which flu patients arrive…
Q: (a) Do you think respondents could select more than one response? Explain. (b) Could the same…
A: 1(a) Yes, respondents could select more than 1 response as the total value of the percentages is…
Q: 5. Jeff's javelin throwing distances have a mean μ and a standard deviation of 15 metres. A sample…
A: standard deviation(σ)=15 sample size(n)=36 Mean(x)=57.50
Q: What is the effect of this violation on the regression model? "The number of observations n is less…
A: Statistical method that estimates the relationship between a dependent variable and one or more…
Q: A newspaper published an article about a study in which researchers subjected laboratory gloves to…
A: We have given thatn1 = 282 n2 = 282 Significance level (α) = 0.10Now,p̂1 = 62%p̂2 = 14% We have…
Q: average, there are four orders in the washing stage and three orders in the drying stage. What is…
A: To calculate the utilization of washers and dryers, we need to determine the average number of…
Q: x 2.5). What is the median checkout duration ? [solve 0.5 = F(M)]. Obtain the density function…
A: By " Bartleby guidelines" Solve first 3 sub part ,i am solving 5 sub part.
Q: An old medical textbook states that the mean sodium level for healthy adults is 142 mEq per liter of…
A: From the provided information, Sample size (n) = 36 Sample mean (x̄) = 138 Population standard…
Q: In Born together-Reared apart: the Landmark Minnesota twin study (2012), Nancy Segal discusses the…
A: The data set is given as- SAT Score no siblings SAT score with siblings 395 370 621 584…
Q: An individual is planning their birthday party. Last year, they invited 30 people and bought 60…
A: An individual is planning their birthday party. Last year they invited 30 people and bought 60…
Q: A major auto dealer has recently unleashed a new advertising campaign for its line of 4-wheel-drive…
A: The auto dealer is interested to see if the new commercial improves the chances of a person watching…
Q: (d) Compute the relative class frequency fin for each class in Table 2-9 and complete the partial…
A: In statistics, frequency is the number of times a data value occurs. These data values are often…
Q: A university student faces a statistics exam, which offers 4 response possibilities. The probability…
A:
Q: A container of soda is supposed to contain 1000 milliliters of soda. A quality control manager wants…
A: we conduct a hypothesis test using the Chi-Square distribution. Null Hypothesis (H0): The standard…
Q: The number of typing errors on a page follows a Poisson distribution with an average of 0.8 per…
A: The number of typing errors on a page follows a Poisson distribution with an average of 0.8 per…
Q: Hamilton County Judges Reporter Kristen DelGuzzi of The Cincinnati Enquirer is writing a piece about…
A: From the provided tree diagram, the following are interpreted: The no of cases that are appealed:…
Q: (a) State the null hypothesis Ho and the alternative hypothesis H₁. H :O H₁:0 (b) Determine the type…
A: Let μ be the population mean sodium level for healthy adults. Given that, Population mean (μ)=138…
Q: n a simple random sample of 100 electronic components produced by a certain method, the mean…
A: Here, n=100, x =125, and σ=20 The confidence level is 0.998 and E = 2.
Q: The coefficient of determination of a set of data points is 0.862 and the slope of the regression…
A: From the given information, The coefficient of determination, r2= 0.862 Slope of the regression…
Q: a. Set up the null and alternative hypothesis (using mathematical notation/numbers and interpret…
A: Let us consider two samples of new design and old design from the larger population Consider the…
Q: The double dot plot shows the runs scored per game by two baseball teams during a 10-game season.…
A: The information provided in the question are as follows :- The dot plot with blue dots shows the…
Q: A Food Marketing Institute found that 26% of households spend more than $125 a week on groceries.…
A: From the provided information, Population proportion (p) = 0.26 Sample size (n) = 64
Q: USA Today reports that the average expenditure on Valentine's Day was expected to be $100.89. Do…
A: The sample size for male consumers is 46 with sample mean 139.34 and for female is 30 with sample…
Q: Say we have a population parameter μ, and the 95% confidence interval for it is (-3, 10). Do you…
A: 95% is (-3, 10).
Q: 1. Interpretation Consider graph (a) of Reasons People Like Texting on Cell Phones, based on a GfK…
A: As asked by you, I have answered question 1. Given the graph of reasons people like texting on Cell…
Q: Eight different dice are rolled and the numbers showing are recorded. How many different outcomes…
A: Eight different dice are rolled
Q: a Standard deviation of 3 years. Identify the Z scores for each raw score then determine the percent…
A: As per Guidelines i have calculated 3 subparts ,plz repost for remaining . mean = 10 year standard…
Q: Claim: The mean pulse rate (in beats per minute) of adult males is equal to 69 bpm. For a random…
A: The hypothesized mean pulse rate (in bpm), .The sample size, i.e., sampled no. of adults, .The…
Q: Write out the probability statement for the following scenario: A factory has two assembly lines (A…
A: By definition, conditional probability indicates the likelihood of occurring of events, with the…
Q: Managers at an automobile manufacturing plant would like to examine the mean completion time, μ, of…
A: The hypothesized mean is 43 minutes.
Q: A marriage counselor has traditionally seen that the proportion p of all married couples for whom…
A: From the provided information,Sample size (n) = 245From which 185 of them stayed together.Sample…
Q: Use the sample data and confidence level to construct the confidence interval estimate of the…
A: n=1200 x=900 CI=99% α=1-0.99=0.01
Question
Calculate the average quarterly variations using the additive model.

Step by step
Solved in 3 steps with 5 images

- In horse racing, a “trifecta” occurs when a bettor wins by selecting the first three finishers in the exact order (1 St place, 2nd place, and 3rd place). How many different trifectas are possible if there are 14 horses in a race?Is the number of games won by a major league baseball team in a season related to the team batting average? The table below shows the number of games won and the batting average (in thousandths) of 8 teams. Team Games Won Batting Average 1 9797 269269 2 9595 275275 3 8686 273273 4 9999 261261 5 6464 285285 6 118118 260260 7 8787 274274 8 8888 280280 Using games won as the explanatory variable ?x, compute the correlation coefficientIs the number of games won by a major league baseball team in a season related to the team batting average? The table below shows the number of games won and the batting average (in thousandths) of 8 teams. Team Games Won Batting Average 1 8383 289289 2 116116 290290 3 101101 287287 4 8181 262262 5 110110 288288 6 119119 269269 7 6060 268268 8 6161 280280 Using games won as the explanatory variable xx, do the following: (a) The correlation coefficient is r=r= . (b) The equation of the least squares line is y^=y^=
- The average consumer unit spent $1874 on apparel and services in2006.That same year, 25 consumer units in the North-east had the following annual expenditures, in dollars, on apparel and services 1417, 1595, 2158, 1820, 1411, 2361, 2371, 2330, 1749, 1872, 2826, 2167, 2304, 1998, 2582, 1982, 1903, 2405, 1660, 2150, 2128, 1889, 2251, 2340, 1850 At the 5% significance level, do the data provide sufficient evidence to conclude that the 2006 mean annual expenditure on apparel and services for consumer units in the Northeast differed from the national mean of $1874?The following stemplot displays the number of forest fires (the stem is in tens of thousands) that occurred each year over the period from 1980 to 2010.6 | 123777797 | 012233344455688 | 035589 | 069How many data values are in this data set?How many fires were in the year with the greatest number of fires from 1980 to 2010?Listed below are the annual hig points of the Dow Jones Industrial Average for a recent sequence of years. The median is 969. Determine if the data occur randomly above and below the median. 969 995 943 985 969 842 951 1036 1052 892 a. In the boxes below each data value, Place an "A" if the value is above the median, a "B" if it is below the median, and a "-" if it equals the median. 969 995 943 985 969 842 951 1036 1052 892 nothing nothing nothing nothing nothing nothing nothing nothing nothing nothing b. If n 1 = # of A's in the sequence, find its value: n 1 = nothing c. If n 2 = # of B's in the sequence, find its value: n 2 = nothing d. Find G, the number of runs: G = nothing e. Find the critical values from Table A-10: Lower critical value = nothing Upper critical value = nothing f. State the technical conclusion: A. Do not…
- Is the number of games won by a major league baseball team in a season related to the team batting average? The table below shows the number of games won and the batting average (in thousandths) of 8 teams. Team Games Won Batting Average 1 6060 259259 2 120120 277277 3 8989 263263 4 101101 288288 5 8585 287287 6 109109 270270 7 7777 272272 8 106106 290290 Using games won as the explanatory variable xx, do the following: (a) The correlation coefficient is r=r= . (b) The equation of the least squares line is y^=y^= . SpeakWhat is the cumulative frequency for the fourth classListed below are the numbers of words spoken in a day by each member of six different couples. Use a 0.05 significant level to test the claim that amount couples, males speak more words in a day than females. Male 5638 21319 17572 16429 46978 25835 Female 5198 21661 19624 13397 41553 28667
- The racial/ethnic diversity of post high school students enrolled at MVCC during the fall 2020 semester is given below. Racial/Ethnic Diversity of Post High School Students Race/Ethnicity Percent* American Indian or Alaska Native 0.4% Asian 5.3% Black or African American 9.6% Hispanic or Latino 9.6% Two or more races 2.8% Native Hawaiian or Pacific Islander <0.1% Non-Resident Alien 0.5% Unknown 1.5% White 70.2% (*Percentages may not total 100 due to rounding) What is the race/ethnicity of the majority of students at MVCC? What total percent of students were either Black or African American or Hispanic or Latino? There were 3,444 students enrolled at MVCC at the time of the study. How many (not percent) students were Asian? (The answer must be a whole number.)The following table shows the approximate number of wireless telephone subscriptions in a certain country for recent years.The following table gives the 2012 total payroll (in millions of dollars) and the percentage of games won during the 2012 season by each of the National League baseball teams. Team Total Payroll (millions of dollars) Percentage of Games Won Arizona Diamondbacks 83 46 Atlanta Braves 89 35 Chicago Cubs 110 57 Cincinnati Reds 111 34 Colorado Rockies 93 39 Los Angeles Dodgers 264 51 Miami Marlins 59 38 Milwaukee Brewers 99 39 New York Mets 95 53 Philadelphia Phillies 127 33 Pittsburgh Pirates 82 58 San Diego Padres 92 40 San Francisco Giants 164 46 St. Louis Cardinals 112 59 Washington Nationals 156 45 Compute the coefficient of determination, ρ2, with percentage of games won as the dependent variable. (Note that this data set belongs to a population.) Carry out all calculations exactly, and round the final answer to three decimal places.