Open StatKey and click on the word mean in the box for Sampling Distributions. Select Hollywood Movies - 2e (Budget) from the top left drop-down menu. Notice th. the picture on the right shows a dot plot and all the summary statistics of the population of all movie budgets Change the sample size to be n = 10. Generate 5000 samples. a) What does each dot in this plot represent? b) What is the standard error for these sample means? c) How would you describe the shape of this sampling distribution?
Open StatKey and click on the word mean in the box for Sampling Distributions. Select Hollywood Movies - 2e (Budget) from the top left drop-down menu. Notice th. the picture on the right shows a dot plot and all the summary statistics of the population of all movie budgets Change the sample size to be n = 10. Generate 5000 samples. a) What does each dot in this plot represent? b) What is the standard error for these sample means? c) How would you describe the shape of this sampling distribution?

Chapter5: Decimals
Section5.5: Averages And Probability
Problem 400E: The cash register receipts each day last week at a coffee shop were $1,845. $1,520. $1,438, $1,682,...

Related questions

Question
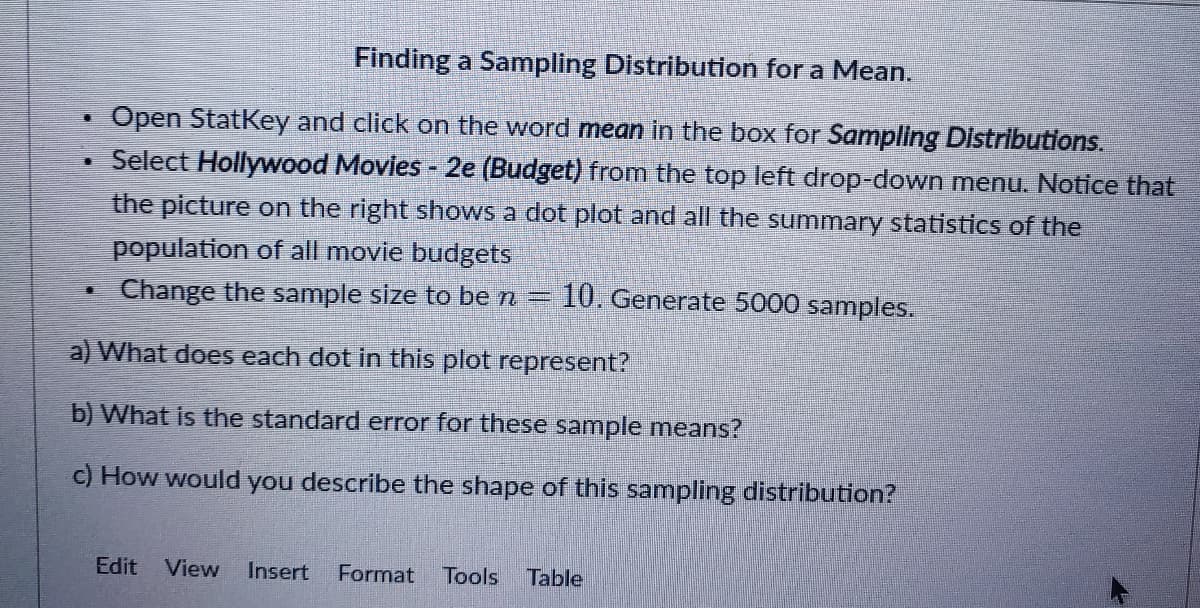
Transcribed Image Text:Finding a Sampling Distribution for a Mean.
Open StatKey and click on the word mean in the box for Sampling Distributions.
Select Hollywood Movies - 2e (Budget) from the top left drop-down menu. Notice that
the picture on the right shows a dot plot and all the summary statistics of the
population of all movie budgets
Change the sample size to be n =
10. Generate 5000 samples.
a) What does each dot in this plot represent?
b) What is the standard error for these sample means?
c) How would you describe the shape of this sampling distribution?
Edit
View
Insert
Format
Tools
Table
Expert Solution
This question has been solved!
Explore an expertly crafted, step-by-step solution for a thorough understanding of key concepts.

This is a popular solution!

Trending now
This is a popular solution!

Step by step
Solved in 2 steps with 2 images

Knowledge Booster


Learn more about
Need a deep-dive on the concept behind this application? Look no further. Learn more about this topic, statistics and related others by exploring similar questions and additional content below.Recommended textbooks for you