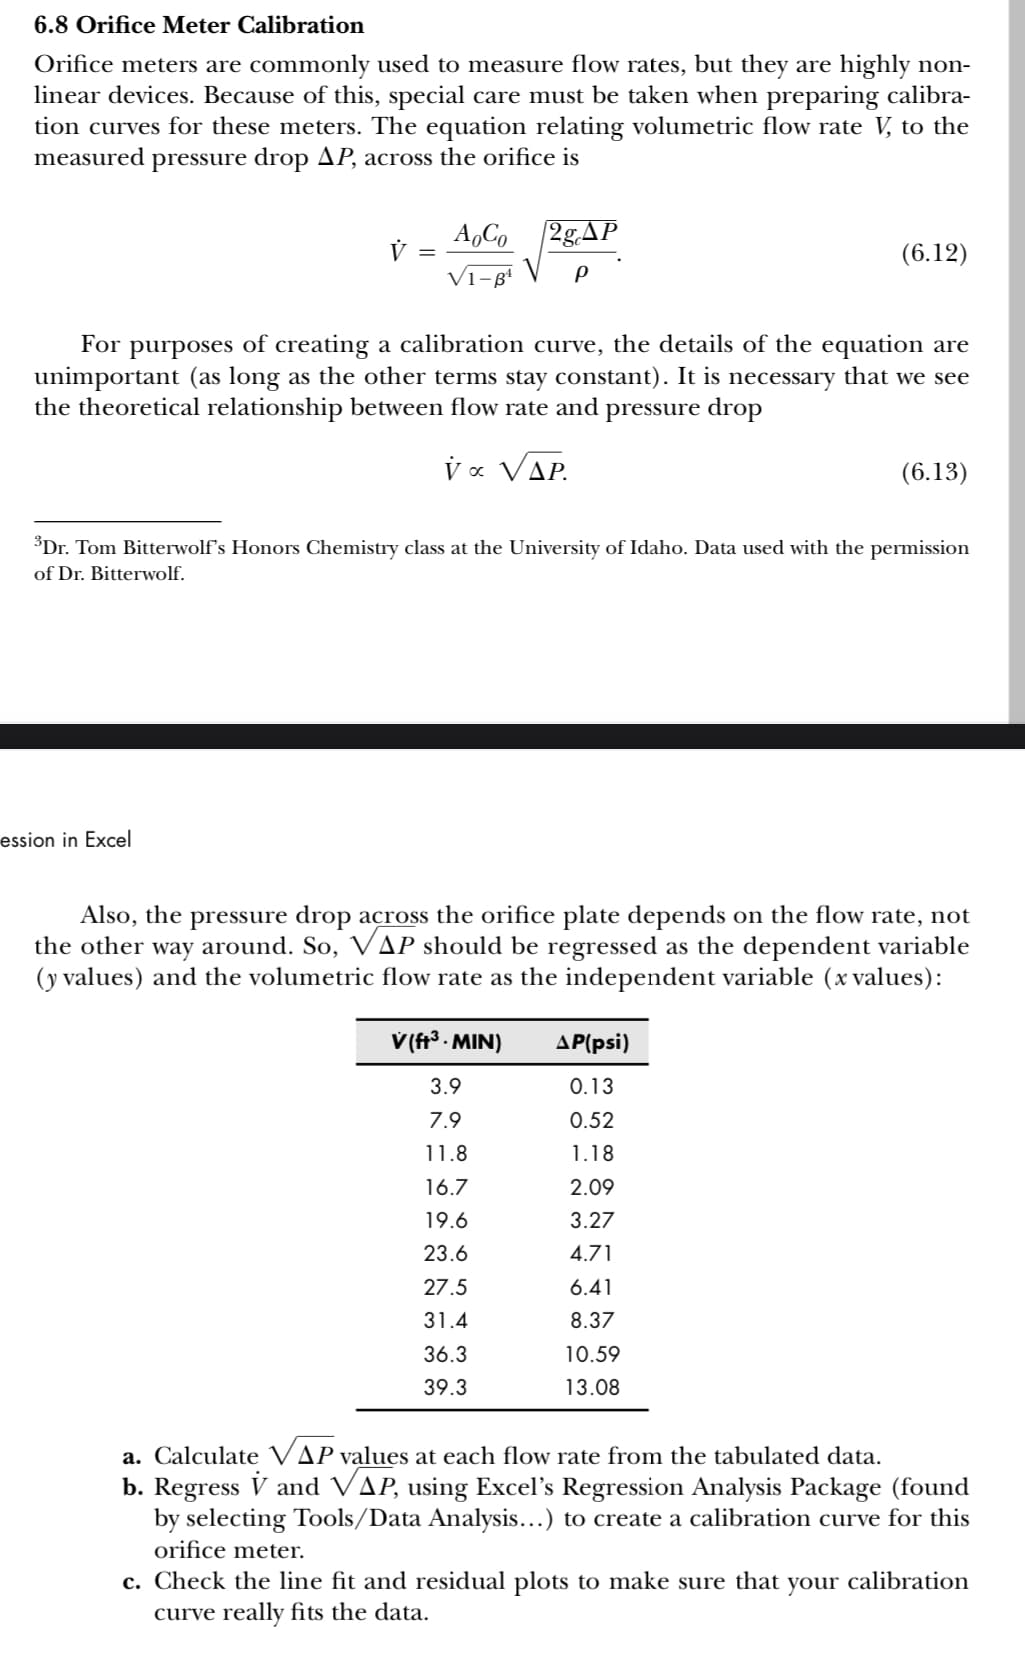
Orifice meters are commonly used to measure flow rates, but they are highly non- linear devices. Because of this, special care must be taken when preparing calibra- tion curves for these meters. The equation relating volumetric flow rate V, to the measured pressure drop AP, across the orifice is V = ion in Excel AgCo2g ΔΡ VI-B¹ P For purposes of creating a calibration curve, the details of the equation are unimportant (as long as the other terms stay constant). It is necessary that we see the theoretical relationship between flow rate and pressure drop να VΔΡ. (6.12) ³Dr. Tom Bitterwolf's Honors Chemistry class at the University of Idaho. Data used with the permission of Dr. Bitterwolf. V (ft³. MIN) 3.9 7.9 11.8 16.7 19.6 23.6 27.5 31.4 36.3 39.3 (6.13) Also, the pressure drop across the orifice plate depends on the flow rate, not the other way around. So, VAP should be regressed as the dependent variable (y values) and the volumetric flow rate as the independent variable (x values): AP(psi) 0.13 0.52 1.18 2.09 3.27 4.71 6.41 8.37 10.59 13.08 a. Calculate VAP values at each flow rate from the tabulated data. b. Regress V and VAP, using Excel's Regression Analysis Package (found by selecting Tools/Data Analysis...) to create a calibration curve for this orifice meter. c. Check the line fit and residual plots to make sure that your calibration curve really fits the data.
Orifice meters are commonly used to measure flow rates, but they are highly non- linear devices. Because of this, special care must be taken when preparing calibra- tion curves for these meters. The equation relating volumetric flow rate V, to the measured pressure drop AP, across the orifice is V = ion in Excel AgCo2g ΔΡ VI-B¹ P For purposes of creating a calibration curve, the details of the equation are unimportant (as long as the other terms stay constant). It is necessary that we see the theoretical relationship between flow rate and pressure drop να VΔΡ. (6.12) ³Dr. Tom Bitterwolf's Honors Chemistry class at the University of Idaho. Data used with the permission of Dr. Bitterwolf. V (ft³. MIN) 3.9 7.9 11.8 16.7 19.6 23.6 27.5 31.4 36.3 39.3 (6.13) Also, the pressure drop across the orifice plate depends on the flow rate, not the other way around. So, VAP should be regressed as the dependent variable (y values) and the volumetric flow rate as the independent variable (x values): AP(psi) 0.13 0.52 1.18 2.09 3.27 4.71 6.41 8.37 10.59 13.08 a. Calculate VAP values at each flow rate from the tabulated data. b. Regress V and VAP, using Excel's Regression Analysis Package (found by selecting Tools/Data Analysis...) to create a calibration curve for this orifice meter. c. Check the line fit and residual plots to make sure that your calibration curve really fits the data.

Introduction to Chemical Engineering Thermodynamics
8th Edition
ISBN:9781259696527
Author:J.M. Smith Termodinamica en ingenieria quimica, Hendrick C Van Ness, Michael Abbott, Mark Swihart
Publisher:J.M. Smith Termodinamica en ingenieria quimica, Hendrick C Van Ness, Michael Abbott, Mark Swihart
Chapter1: Introduction
Section: Chapter Questions
Problem 1.1P

Related questions
Question
excel spreadsheet
Transcribed Image Text:6.8 Orifice Meter Calibration
Orifice meters are commonly used to measure flow rates, but they are highly non-
linear devices. Because of this, special care must be taken when preparing calibra-
tion curves for these meters. The equation relating volumetric flow rate V, to the
measured pressure drop AP, across the orifice is
=
AoCo
VI-B¹
ession in Excel
For purposes of creating a calibration curve, the details of the equation are
unimportant (as long as the other terms stay constant). It is necessary that we see
the theoretical relationship between flow rate and pressure drop
να V ΔΡ.
2gAP
P
³Dr. Tom Bitterwolf's Honors Chemistry class at the University of Idaho. Data used with the permission
of Dr. Bitterwolf.
V (ft³. MIN)
3.9
7.9
11.8
16.7
19.6
23.6
27.5
31.4
36.3
39.3
(6.12)
Also, the pressure drop across the orifice plate depends on the flow rate, not
the other way around. So, VAP should be regressed as the dependent variable
(y values) and the volumetric flow rate as the independent variable (x values):
AP(psi)
0.13
0.52
1.18
2.09
3.27
4.71
6.41
8.37
10.59
13.08
(6.13)
c. Check the line fit and residual plots to make sure that your
curve really fits the data.
a. Calculate VAP values at each flow rate from the tabulated data.
b. Regress V and VAP, using Excel's Regression Analysis Package (found
by selecting Tools/Data Analysis...) to create a calibration curve for this
orifice meter.
calibration
Expert Solution
This question has been solved!
Explore an expertly crafted, step-by-step solution for a thorough understanding of key concepts.

This is a popular solution!

Trending now
This is a popular solution!

Step by step
Solved in 3 steps with 2 images

Recommended textbooks for you
Introduction to Chemical Engineering Thermodynami…
Chemical Engineering
ISBN:
9781259696527
Author:
J.M. Smith Termodinamica en ingenieria quimica, Hendrick C Van Ness, Michael Abbott, Mark Swihart
Publisher:
McGraw-Hill Education

Elementary Principles of Chemical Processes, Bind…
Chemical Engineering
ISBN:
9781118431221
Author:
Richard M. Felder, Ronald W. Rousseau, Lisa G. Bullard
Publisher:
WILEY

Elements of Chemical Reaction Engineering (5th Ed…
Chemical Engineering
ISBN:
9780133887518
Author:
H. Scott Fogler
Publisher:
Prentice Hall
Introduction to Chemical Engineering Thermodynami…
Chemical Engineering
ISBN:
9781259696527
Author:
J.M. Smith Termodinamica en ingenieria quimica, Hendrick C Van Ness, Michael Abbott, Mark Swihart
Publisher:
McGraw-Hill Education
Elementary Principles of Chemical Processes, Bind…
Chemical Engineering
ISBN:
9781118431221
Author:
Richard M. Felder, Ronald W. Rousseau, Lisa G. Bullard
Publisher:
WILEY
Elements of Chemical Reaction Engineering (5th Ed…
Chemical Engineering
ISBN:
9780133887518
Author:
H. Scott Fogler
Publisher:
Prentice Hall


Industrial Plastics: Theory and Applications
Chemical Engineering
ISBN:
9781285061238
Author:
Lokensgard, Erik
Publisher:
Delmar Cengage Learning

Unit Operations of Chemical Engineering
Chemical Engineering
ISBN:
9780072848236
Author:
Warren McCabe, Julian C. Smith, Peter Harriott
Publisher:
McGraw-Hill Companies, The