ou may need to use this table to answer this question. he following are quality control data for a manufacturing process at Kensport Chemical Company. The data show the temperature in degrees centigrade at five points in time during a manufacturing cy Sample R 95.72 1.0 95.24 0.9 3. 95.18 0.9 4 95.44 0.4 5 95.46 0.5 6 95.32 1.1 95.40 0.9 95.44 0.3 95.08 0.2
ou may need to use this table to answer this question. he following are quality control data for a manufacturing process at Kensport Chemical Company. The data show the temperature in degrees centigrade at five points in time during a manufacturing cy Sample R 95.72 1.0 95.24 0.9 3. 95.18 0.9 4 95.44 0.4 5 95.46 0.5 6 95.32 1.1 95.40 0.9 95.44 0.3 95.08 0.2

Glencoe Algebra 1, Student Edition, 9780079039897, 0079039898, 2018
18th Edition
ISBN:9780079039897
Author:Carter
Publisher:Carter
Chapter10: Statistics
Section10.6: Summarizing Categorical Data
Problem 4AGP

Related questions
Topic Video
Question
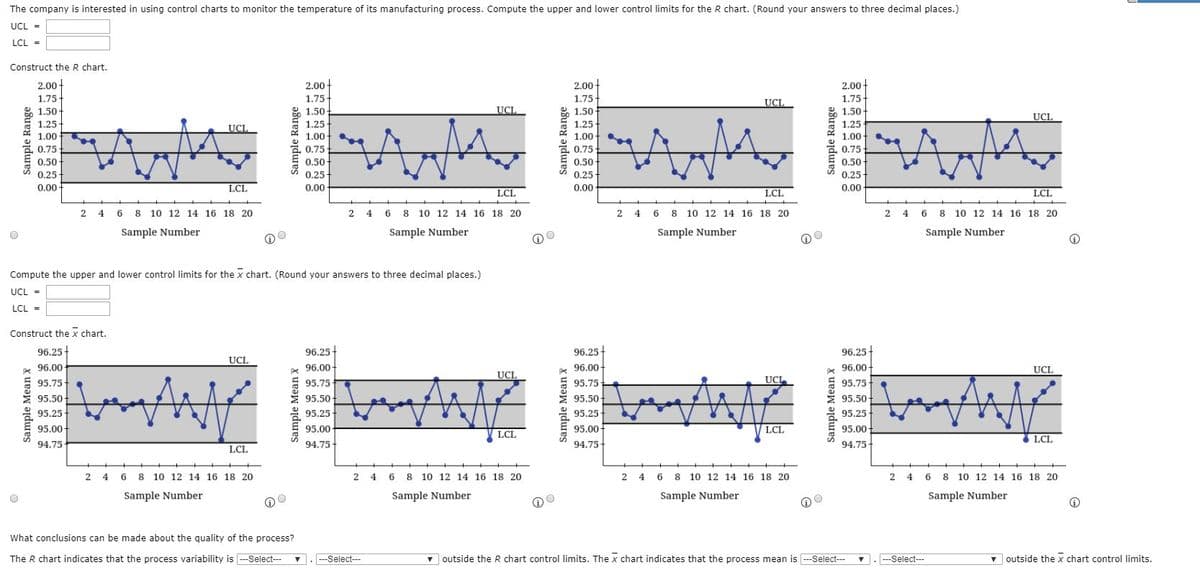
Transcribed Image Text:The company is interested in using control charts to monitor the temperature of its manufacturing process. Compute the upper and lower control limits for the R chart. (Round your answers to three decimal places.)
UCL =
LCL =
Construct the R chart.
2.00-
2.00-
2.00
2.00
1.75
1.75-
1.75
1.75
UCL
1.50
1.50
UCL
& 1.50
* 1.50
UCL
1.25
1.25
1.25
1.25
UCI
1.00
1.00
1.00
1.00
0.75
0.75
0.75
0.75
0.50-
0.50
0.50
0.50
0.25-
0.25
0.25
0.25
0.00 -
LCL
0.00
LCL
0.00
LCL
0.00
LCL
6
8
10 12 14 16 18 20
2 4
8 10 12 14 16 18 20
2 4
8 10 12 14 16 18 20
2 4
10 12 14 16 18 20
Sample Number
Sample Number
Sample Number
Sample Number
Compute the upper and lower control limits for the x chart. (Round your answers to three decimal places.)
UCL =
LCL =
Construct the x chart.
96.25-
96.25
96.25
96.25
UCL
96.00
* 96.00-
96.00
96.00
UCL
UCL
95.75
95.75
95.75
UCL
95.75
95.50
95.50
95.50
95,50
95.25
95.25
95.25
95.25
95.00-
95.00
95.00-
LCL
95.00
LCL
LCL
94.75
LCL
94.75
94.75
94.75
2 4
8 10 12 14 16 18 20
4
6.
8 10 12 14 16 18 20
2 4
8 10 12 14 16 18 20
2 4
6.
8 10 12 14 16 18 20
Sample Number
Sample Number
Sample Number
Sample Number
What conclusions can be made about the quality of the process?
The R chart indicates that the process variability is --Select---
---Select---
v outside the R chart control limits. The x chart indicates that the process mean is --Select--
---Select--
v outside the x chart control limits.
Sample Mean X
Sample Mean X
Sample Mean x
Sample Mean X
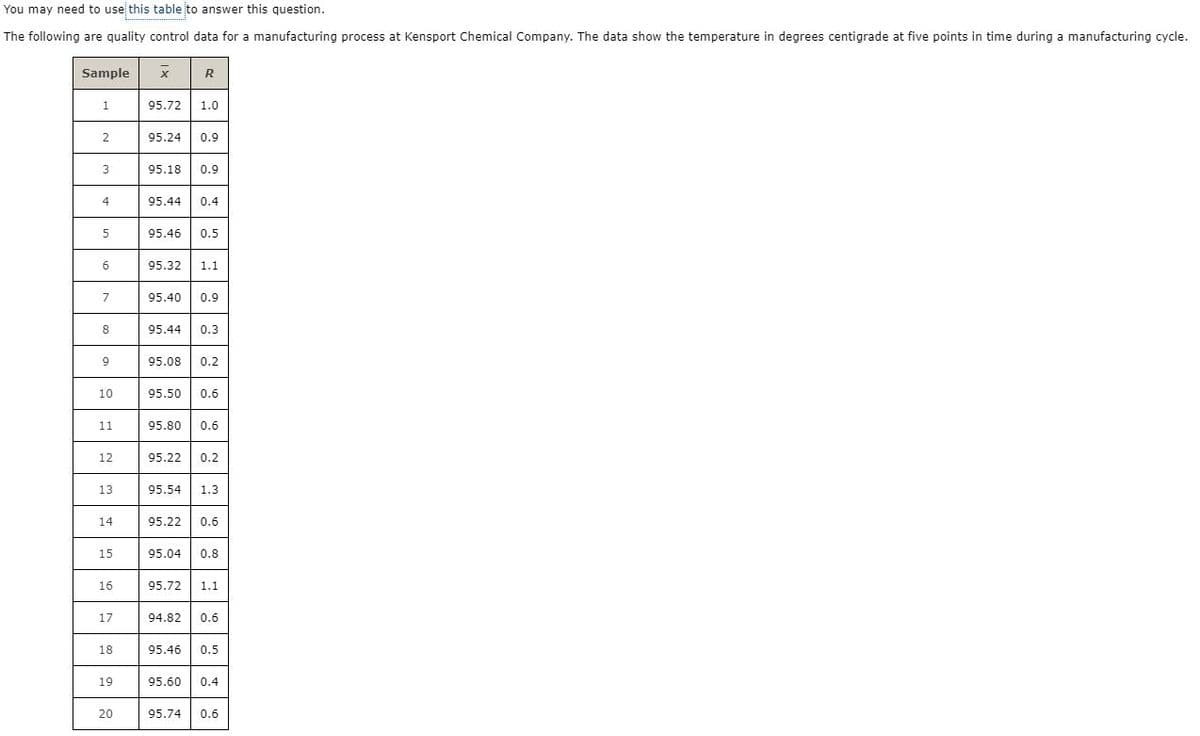
Transcribed Image Text:You may need to use this table to answer this question.
The following are quality control data for a manufacturing process at Kensport Chemical Company. The data show the temperature in degrees centigrade at five points in time during a manufacturing cycle.
Sample
R
1.
95.72
1.0
95.24
0.9
3
95.18
0.9
4
95.44
0.4
95.46
0.5
6
95.32
1.1
7.
95.40
0.9
8
95.44
0.3
95.08
0.2
10
95.50
0.6
11
95.80
0.6
12
95.22
0.2
13
95.54
1.3
14
95.22
0.6
15
95.04
0.8
16
95.72
1.1
17
94.82
0.6
18
95.46
0.5
19
95.60
0.4
20
95.74
0.6
|||ド
Expert Solution
This question has been solved!
Explore an expertly crafted, step-by-step solution for a thorough understanding of key concepts.

Step by step
Solved in 2 steps with 2 images

Knowledge Booster


Learn more about
Need a deep-dive on the concept behind this application? Look no further. Learn more about this topic, statistics and related others by exploring similar questions and additional content below.Recommended textbooks for you
Glencoe Algebra 1, Student Edition, 9780079039897…
Algebra
ISBN:
9780079039897
Author:
Carter
Publisher:
McGraw Hill
Glencoe Algebra 1, Student Edition, 9780079039897…
Algebra
ISBN:
9780079039897
Author:
Carter
Publisher:
McGraw Hill