The following six advertising campaigns show the number of ads (x) and the resulting sales revenues (y) from each advertising campaign. Table 1 illustrates the data. 1. TABLE 1. Sample data for sales (y) and number of ads(x) Obs. y Xi – x (X¡ – x)² | Yi – ỹ | (X; – x)(yi – 7) | Îi ei (y; – y)² (i - T)² 1 10 49 41 3 16 49 4 8 36 12 46 6 8 43
The following six advertising campaigns show the number of ads (x) and the resulting sales revenues (y) from each advertising campaign. Table 1 illustrates the data. 1. TABLE 1. Sample data for sales (y) and number of ads(x) Obs. y Xi – x (X¡ – x)² | Yi – ỹ | (X; – x)(yi – 7) | Îi ei (y; – y)² (i - T)² 1 10 49 41 3 16 49 4 8 36 12 46 6 8 43

Chapter9: Sequences, Probability And Counting Theory
Section: Chapter Questions
Problem 47RE: For the following exercises, assume two die are rolled. 47. Construct a table showing the sample...

Related questions
Question
-
What is the standard error of the estimate, s? What is the estimated standard deviation of b1, that is sb1?
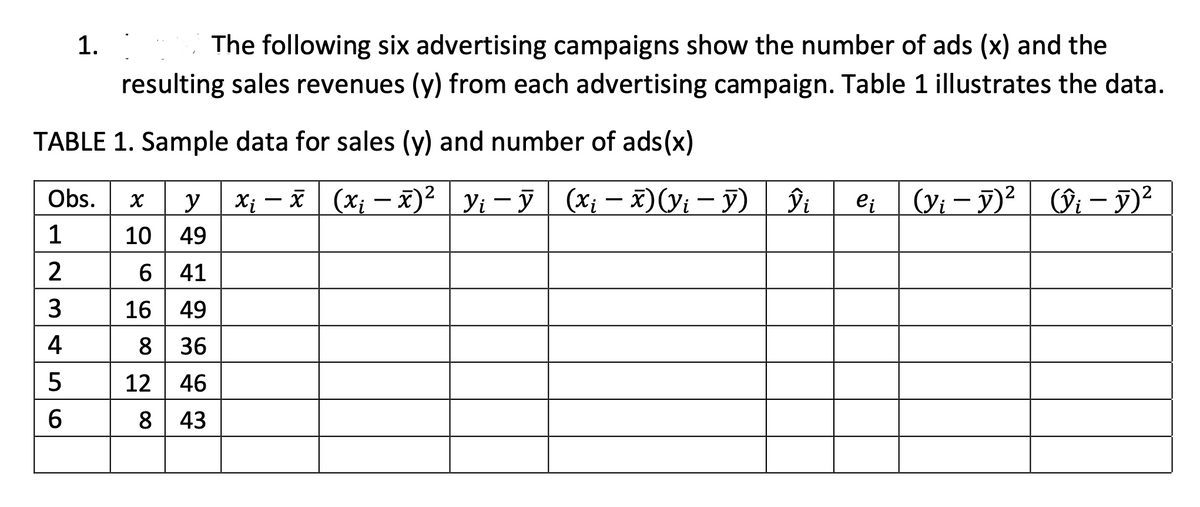
Transcribed Image Text:The following six advertising campaigns show the number of ads (x) and the
resulting sales revenues (y) from each advertising campaign. Table 1 illustrates the data.
1.
TABLE 1. Sample data for sales (y) and number of ads(x)
Obs.
у
X; – x (x; – x)² yi - ỹ (X¡ – x)(y; – y)
e (yi - 7)? (ŷi – y)?
Vi – y)²
1
10
49
6 41
3
16
49
4
8 36
12
46
6.
8 43
Expert Solution
This question has been solved!
Explore an expertly crafted, step-by-step solution for a thorough understanding of key concepts.

This is a popular solution!

Trending now
This is a popular solution!

Step by step
Solved in 5 steps with 5 images

Recommended textbooks for you

Glencoe Algebra 1, Student Edition, 9780079039897…
Algebra
ISBN:
9780079039897
Author:
Carter
Publisher:
McGraw Hill
Glencoe Algebra 1, Student Edition, 9780079039897…
Algebra
ISBN:
9780079039897
Author:
Carter
Publisher:
McGraw Hill