Our cla orded the temperature at noon each day for 21 school days in the spring. The lowest temperature (in °F) was 77, and the highest was 83. The table gives the mean, median, range, and interquartile range (IQR) of the data set. Summary values Mean Median Range IQR 80 80 6. (a) Select the best description of spread for the data set. (b) Select the best description of center for the data set. OThe middle half of the data set is 2 units wide. (This is OBased on the range, we see that the "average" the IQR.) temperature (in °F) was about 6. OThe middle half of the data set is 80 units wide. (This is OBased on the mean and median, we see that the the median.) "average" temperature (in °F) was about 80. OThe middle half of the data set is 21 units wide. (This is OBased on the IQR, we see that the "average" the number of days the temperature was recorded.) temperature (in °F) was about 2. (c) Select the graph with the shape that best fits the summary values. O Graph 1 (The data set is not symmetric.) O Graph 2 (The data set is symmetric.) 77 78 79 80 81 82 83 76 77 78 79 80 Number of days Number of days
Our cla orded the temperature at noon each day for 21 school days in the spring. The lowest temperature (in °F) was 77, and the highest was 83. The table gives the mean, median, range, and interquartile range (IQR) of the data set. Summary values Mean Median Range IQR 80 80 6. (a) Select the best description of spread for the data set. (b) Select the best description of center for the data set. OThe middle half of the data set is 2 units wide. (This is OBased on the range, we see that the "average" the IQR.) temperature (in °F) was about 6. OThe middle half of the data set is 80 units wide. (This is OBased on the mean and median, we see that the the median.) "average" temperature (in °F) was about 80. OThe middle half of the data set is 21 units wide. (This is OBased on the IQR, we see that the "average" the number of days the temperature was recorded.) temperature (in °F) was about 2. (c) Select the graph with the shape that best fits the summary values. O Graph 1 (The data set is not symmetric.) O Graph 2 (The data set is symmetric.) 77 78 79 80 81 82 83 76 77 78 79 80 Number of days Number of days

Glencoe Algebra 1, Student Edition, 9780079039897, 0079039898, 2018
18th Edition
ISBN:9780079039897
Author:Carter
Publisher:Carter
Chapter10: Statistics
Section10.4: Distributions Of Data
Problem 22PFA

Related questions
Question
Transcribed Image Text:Our cla
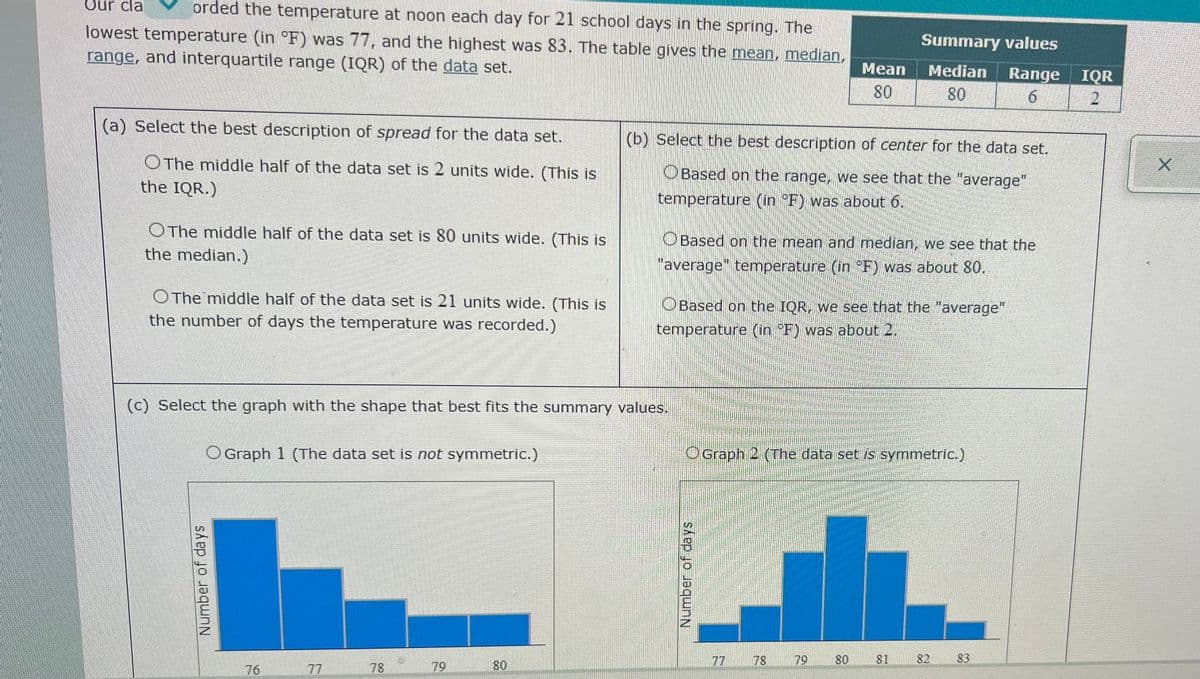
orded the temperature at noon each day for 21 school days in the spring. The
lowest temperature (in °F) was 77, and the highest was 83. The table gives the mean, median,
range, and interquartile range (IQR) of the data set.
Summary values
Mean
Median
Range
IQR
2.
80
80
6.
(a) Select the best description of spread for the data set.
(b) Select the best description of center for the data set.
OThe middle half of the data set is 2 units wide. (This is
the IQR.)
OBased on the range, we see that the "average"
temperature (in °F) was about 6.
OThe middle half of the data set is 80 units wide. (This is
the median.)
OBased on the mean and median, we see that the
"average" temperature (in F) was about 80.
OThe middle half of the data set is 21 units wide. (This is
the number of days the temperature was recorded.)
OBased on the IQR, we see that the "average"
temperature (in F) was about 2
(c) Select the graph with the shape that best fits the summary values.
O Graph 1 (The data set is not symmetric.)
OGraph 2 (The data set is symmetric.)
77
78
79
80
81
82
83
76
77
78
79
80
Number of days
Number of days
Expert Solution
This question has been solved!
Explore an expertly crafted, step-by-step solution for a thorough understanding of key concepts.

Step by step
Solved in 2 steps with 2 images

Recommended textbooks for you
Glencoe Algebra 1, Student Edition, 9780079039897…
Algebra
ISBN:
9780079039897
Author:
Carter
Publisher:
McGraw Hill

Holt Mcdougal Larson Pre-algebra: Student Edition…
Algebra
ISBN:
9780547587776
Author:
HOLT MCDOUGAL
Publisher:
HOLT MCDOUGAL
Glencoe Algebra 1, Student Edition, 9780079039897…
Algebra
ISBN:
9780079039897
Author:
Carter
Publisher:
McGraw Hill
Holt Mcdougal Larson Pre-algebra: Student Edition…
Algebra
ISBN:
9780547587776
Author:
HOLT MCDOUGAL
Publisher:
HOLT MCDOUGAL