The table and scatter plot show the time spent watching TV, x, and the time spent doing homework, y, by each of 11 students last week The equation of the line of best fit is y= -0.3x+20.43. Time spent Time spent doing homework, y watching TV, x 32 (in hours) (in hours) 28 5.9 19.40 24 6.6 16.70 Time spent doing homework 20 8.1 21.12 (in hours) 16 10.3 15.71 12 10.4 18.93 8. 12.0 15.50 4- 13.5 16.15 15.1 19.00 10 12 14 16 18 20 22 Time spent watching TV (in hours) 16.5 16.43 17.9 17.50 20.5 13.30 Use the equation of the line of best fit to fill in the blanks below. Give exact answers, not rounded approximations. Time spent watching TV (in hours) Observed time spent doing homework (in hours) Predicted time spent doing homework (in hours) Residual (in hours) 15.1 17.9
The table and scatter plot show the time spent watching TV, x, and the time spent doing homework, y, by each of 11 students last week The equation of the line of best fit is y= -0.3x+20.43. Time spent Time spent doing homework, y watching TV, x 32 (in hours) (in hours) 28 5.9 19.40 24 6.6 16.70 Time spent doing homework 20 8.1 21.12 (in hours) 16 10.3 15.71 12 10.4 18.93 8. 12.0 15.50 4- 13.5 16.15 15.1 19.00 10 12 14 16 18 20 22 Time spent watching TV (in hours) 16.5 16.43 17.9 17.50 20.5 13.30 Use the equation of the line of best fit to fill in the blanks below. Give exact answers, not rounded approximations. Time spent watching TV (in hours) Observed time spent doing homework (in hours) Predicted time spent doing homework (in hours) Residual (in hours) 15.1 17.9

Glencoe Algebra 1, Student Edition, 9780079039897, 0079039898, 2018
18th Edition
ISBN:9780079039897
Author:Carter
Publisher:Carter
Chapter1: Expressions And Functions
Section1.8: Interpreting Graphs Of Functions
Problem 4CYU

Related questions
Question
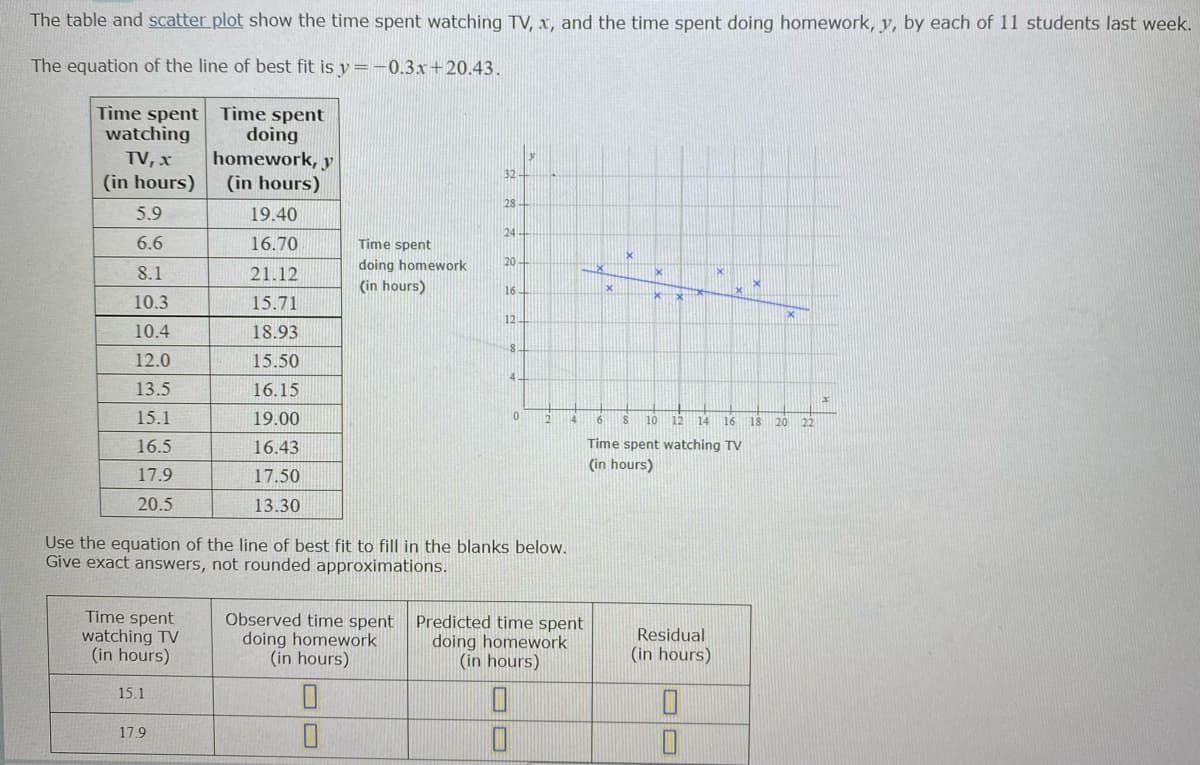
Transcribed Image Text:The table and scatter plot show the time spent watching TV, x, and the time spent doing homework, y, by each of 11 students last week.
The equation of the line of best fit is y =-0.3x+20.43.
Time spent
watching
TV, x
Time spent
doing
homework, y
(in hours)
32
(in hours)
28
5.9
19.40
24
6.6
16.70
Time spent
doing homework
20
8.1
21.12
(in hours)
16
10.3
15.71
12
10.4
18.93
12.0
15.50
4.
13.5
16.15
15.1
19.00
10 12
14
16
18
20
22
16.5
16.43
Time spent watching TV
(in hours)
17.9
17.50
20.5
13.30
Use the equation of the line of best fit to fill in the blanks below.
Give exact answers, not rounded approximations.
Time spent
watching TV
(in hours)
Observed time spent Predicted time spent
doing homework
(in hours)
doing homework
(in hours)
Residual
(in hours)
15.1
17.9
DO
Expert Solution
This question has been solved!
Explore an expertly crafted, step-by-step solution for a thorough understanding of key concepts.

This is a popular solution!

Trending now
This is a popular solution!

Step by step
Solved in 2 steps with 1 images

Recommended textbooks for you
Glencoe Algebra 1, Student Edition, 9780079039897…
Algebra
ISBN:
9780079039897
Author:
Carter
Publisher:
McGraw Hill

College Algebra (MindTap Course List)
Algebra
ISBN:
9781305652231
Author:
R. David Gustafson, Jeff Hughes
Publisher:
Cengage Learning

Linear Algebra: A Modern Introduction
Algebra
ISBN:
9781285463247
Author:
David Poole
Publisher:
Cengage Learning
Glencoe Algebra 1, Student Edition, 9780079039897…
Algebra
ISBN:
9780079039897
Author:
Carter
Publisher:
McGraw Hill
College Algebra (MindTap Course List)
Algebra
ISBN:
9781305652231
Author:
R. David Gustafson, Jeff Hughes
Publisher:
Cengage Learning
Linear Algebra: A Modern Introduction
Algebra
ISBN:
9781285463247
Author:
David Poole
Publisher:
Cengage Learning

Elementary Algebra
Algebra
ISBN:
9780998625713
Author:
Lynn Marecek, MaryAnne Anthony-Smith
Publisher:
OpenStax - Rice University


Algebra & Trigonometry with Analytic Geometry
Algebra
ISBN:
9781133382119
Author:
Swokowski
Publisher:
Cengage