f. The p-value for this sample= (Please show your answer to four decimal places.)

Glencoe Algebra 1, Student Edition, 9780079039897, 0079039898, 2018
18th Edition
ISBN:9780079039897
Author:Carter
Publisher:Carter
Chapter10: Statistics
Section10.4: Distributions Of Data
Problem 19PFA

Related questions
Question
100%
P12help part F please
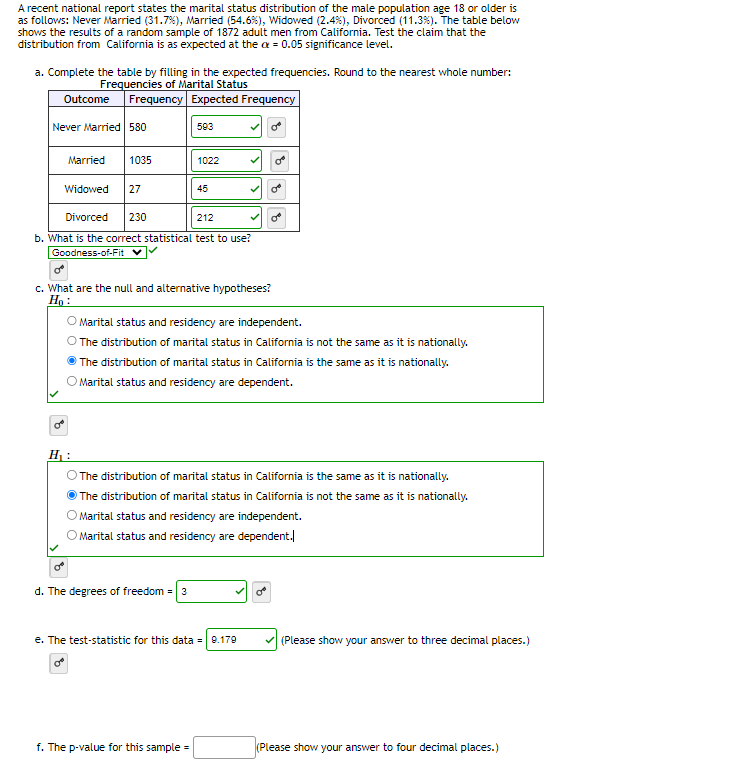
Transcribed Image Text:A recent national report states the marital status distribution of the male population age 18 or older is
as follows: Never Married (31.7%) , Married (54.6%), Widowed (2.4%), Divorced (11.3%). The table below
shows the results of a random sample of 1872 adult men from California. Test the claim that the
distribution from California is as expected at the = 0.05 significance level.
a. Complete the table by filling in the expected frequencies. Round to the nearest whole number:
Frequencies of Marital Status
Outcome Frequency Expected Frequency
Never Married 580
Married
1035
Widowed 27
O
Divorced 230
212
b. What is the correct statistical test to use?
Goodness-of-Fit ✔
O
593
1022
c. What are the null and alternative hypotheses?
Ho:
d. The degrees of freedom = 3
45
O Marital status and residency are independent.
O The distribution of marital status in California is not the same as it is nationally.
The distribution of marital status in California is the same as it is nationally.
Marital status and residency are dependent.
H₁:
O The distribution of marital status in California is the same as it is nationally.
ⒸThe distribution of marital status in California is not the same as it is nationally.
Marital status and residency are independent.
Marital status and residency are dependent.
f. The p-value for this sample=
8
e. The test-statistic for this data = 9.179
(Please show your answer to three decimal places.)
(Please show your answer to four decimal places.)
Expert Solution
This question has been solved!
Explore an expertly crafted, step-by-step solution for a thorough understanding of key concepts.

Step by step
Solved in 3 steps

Follow-up Questions
Read through expert solutions to related follow-up questions below.
Follow-up Question
p17 need help with D F G please

Transcribed Image Text:A biologist looked at the relationship between number of seeds a plant produces and the percent of those
seeds that sprout. The results of the survey are shown below.
51
Seeds Produced 68 67 66
Sprout Percent 60.8 57.2 55.6 68.6
a. Find the correlation coefficient: r = -0.83
b. The null and alternative hypotheses for correlation are:
Ho: P✓ ✓ = 0
H₁: P
م من 0+
The p-value is: 0.0056
43
74.8
(Round to four decimal places)
c. Use a level of significance of ax = 0.05 to state the conclusion of the hypothesis test in the context
of the study.
60
59 59 58
66 68.4 63.4 73.8
There is statistically significant evidence to conclude that there is a correlation between the
number of seeds that a plant produces and the percent of the seeds that sprout. Thus, the
regression line is useful.
d. T² = 0.69
e. Interpret ²:
Round to 2 decimal places.
O There is statistically significant evidence to conclude that a plant that produces more seeds
will have seeds with a lower sprout rate than a plant that produces fewer seeds.
There is statistically insignificant evidence to conclude that a plant that produces more seeds
will have seeds with a lower sprout rate than a plant that produces fewer seeds.
There is statistically insignificant evidence to conclude that there is a correlation between the
number of seeds that a plant produces and the percent of the seeds that sprout. Thus, the use
of the regression line is not appropriate.
x (Round to two decimal places)
There is a large variation in the percent of seeds that sprout, but if you only look at plants
that produce a fixed number of seeds, this variation on average is reduced by 68%.
f. The equation of the linear regression line is:
O Given any group of plants that all produce the same number of seeds, 68% of all of these
plants will produce seeds with the same chance of sprouting.
68% of all plants produce seeds whose chance of sprouting is the average chance of sprouting.
There is a 68% chance that the regression line will be a good predictor for the percent of seeds
that sprout based on the number of seeds produced.
(Please show your answers to two decimal places)
g. Use the model to predict the percent of seeds that sprout if the plant produces 54 seeds.
Percent sprouting =
(Please round your answer to the nearest whole number.)
Solution
Recommended textbooks for you
Glencoe Algebra 1, Student Edition, 9780079039897…
Algebra
ISBN:
9780079039897
Author:
Carter
Publisher:
McGraw Hill

College Algebra (MindTap Course List)
Algebra
ISBN:
9781305652231
Author:
R. David Gustafson, Jeff Hughes
Publisher:
Cengage Learning
Glencoe Algebra 1, Student Edition, 9780079039897…
Algebra
ISBN:
9780079039897
Author:
Carter
Publisher:
McGraw Hill
College Algebra (MindTap Course List)
Algebra
ISBN:
9781305652231
Author:
R. David Gustafson, Jeff Hughes
Publisher:
Cengage Learning