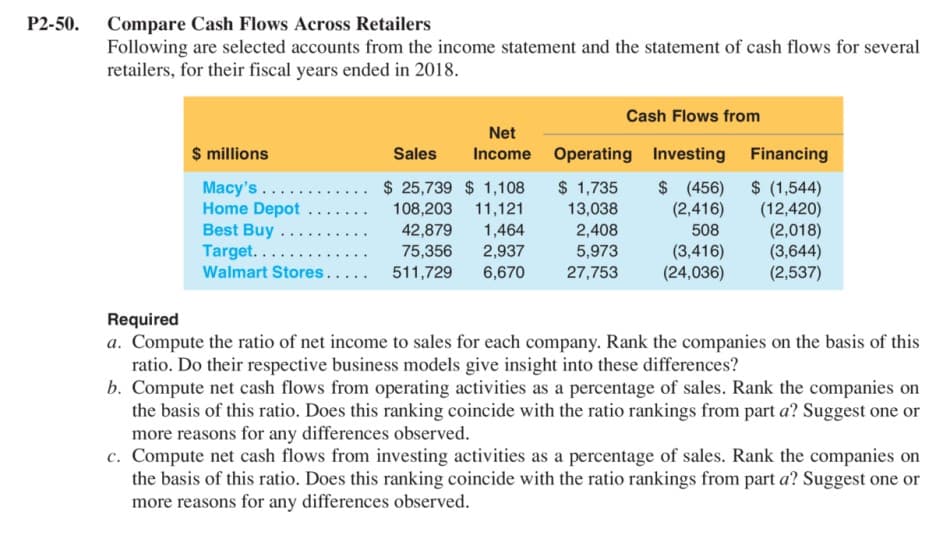
P2-50. Compare Cash Flows Across Retailers Following are selected accounts from the income statement and the statement of cash flows for several retailers, for their fiscal years ended in 2018. Cash Flows from Net $ millions Sales Income Operating Investing Financing $ 25,739 $ 1,108 108,203 $ 1,735 13,038 Macy's...... Home Depot Best Buy Target... $ (456) (2,416) 508 (3,416) (24,036) $ (1,544) (12,420) (2,018) (3,644) (2,537) 11,121 .... .. 42,879 75,356 511,729 1,464 2,937 6,670 2,408 5,973 ..... Walmart Stores.. 27,753 Required a. Compute the ratio of net income to sales for each company. Rank the companies on the basis of this ratio. Do their respective business models give insight into these differences? b. Compute net cash flows from operating activities as a percentage of sales. Rank the companies on the basis of this ratio. Does this ranking coincide with the ratio rankings from part a? Suggest one or more reasons for any differences observed. c. Compute net cash flows from investing activities as a percentage of sales. Rank the companies on the basis of this ratio. Does this ranking coincide with the ratio rankings from part a? Suggest one or more reasons for any differences observed.
P2-50. Compare Cash Flows Across Retailers Following are selected accounts from the income statement and the statement of cash flows for several retailers, for their fiscal years ended in 2018. Cash Flows from Net $ millions Sales Income Operating Investing Financing $ 25,739 $ 1,108 108,203 $ 1,735 13,038 Macy's...... Home Depot Best Buy Target... $ (456) (2,416) 508 (3,416) (24,036) $ (1,544) (12,420) (2,018) (3,644) (2,537) 11,121 .... .. 42,879 75,356 511,729 1,464 2,937 6,670 2,408 5,973 ..... Walmart Stores.. 27,753 Required a. Compute the ratio of net income to sales for each company. Rank the companies on the basis of this ratio. Do their respective business models give insight into these differences? b. Compute net cash flows from operating activities as a percentage of sales. Rank the companies on the basis of this ratio. Does this ranking coincide with the ratio rankings from part a? Suggest one or more reasons for any differences observed. c. Compute net cash flows from investing activities as a percentage of sales. Rank the companies on the basis of this ratio. Does this ranking coincide with the ratio rankings from part a? Suggest one or more reasons for any differences observed.

Financial Accounting
15th Edition
ISBN:9781337272124
Author:Carl Warren, James M. Reeve, Jonathan Duchac
Publisher:Carl Warren, James M. Reeve, Jonathan Duchac
Chapter16: Statement Of Cash Flows
Section: Chapter Questions
Problem 21E

Related questions
Question
100%
Transcribed Image Text:P2-50. Compare Cash Flows Across Retailers
Following are selected accounts from the income statement and the statement of cash flows for several
retailers, for their fiscal years ended in 2018.
Cash Flows from
Net
$ millions
Sales
Income Operating Investing Financing
Macy's.....
Home Depot
Best Buy.
Target.....
Walmart Stores.....
$ 25,739 $ 1,108
108,203
11,121
42,879
$ (1,544)
(12,420)
(2,018)
(3,644)
(2,537)
$ 1,735
13,038
$ ( 456)
(2,416)
1,464
2,937
2,408
5,973
508
....
75,356
511,729
(3,416)
(24,036)
6,670
27,753
Required
a. Compute the ratio of net income to sales for each company. Rank the companies on the basis of this
ratio. Do their respective business models give insight into these differences?
b. Compute net cash flows from operating activities as a percentage of sales. Rank the companies on
the basis of this ratio. Does this ranking coincide with the ratio rankings from part a? Suggest one or
more reasons for any differences observed.
c. Compute net cash flows from investing activities as a percentage of sales. Rank the companies on
the basis of this ratio. Does this ranking coincide with the ratio rankings from part a? Suggest one or
more reasons for any differences observed.
Expert Solution
This question has been solved!
Explore an expertly crafted, step-by-step solution for a thorough understanding of key concepts.

This is a popular solution!

Trending now
This is a popular solution!

Step by step
Solved in 4 steps

Knowledge Booster


Learn more about
Need a deep-dive on the concept behind this application? Look no further. Learn more about this topic, finance and related others by exploring similar questions and additional content below.Recommended textbooks for you
Financial Accounting
Accounting
ISBN:
9781337272124
Author:
Carl Warren, James M. Reeve, Jonathan Duchac
Publisher:
Cengage Learning

Financial Accounting
Accounting
ISBN:
9781305088436
Author:
Carl Warren, Jim Reeve, Jonathan Duchac
Publisher:
Cengage Learning

Financial Accounting
Accounting
ISBN:
9781337272124
Author:
Carl Warren, James M. Reeve, Jonathan Duchac
Publisher:
Cengage Learning
Financial Accounting
Accounting
ISBN:
9781305088436
Author:
Carl Warren, Jim Reeve, Jonathan Duchac
Publisher:
Cengage Learning

Cornerstones of Financial Accounting
Accounting
ISBN:
9781337690881
Author:
Jay Rich, Jeff Jones
Publisher:
Cengage Learning
Principles of Accounting Volume 1
Accounting
ISBN:
9781947172685
Author:
OpenStax
Publisher:
OpenStax College