Packed in at Rush Hour! Sq. Ft. per standing passenger Morning Morning Afternoon Afterne 1988 1.5 1.8 1.9 1.9 In 1990 the New York Times reported the average number of square feet per standing passenger in 1987 and 1988 for 19 subway 1987 2.4 2.7 2.9 3 3.1 3.6 3.6 3.6 3.7 3.8 6.7 1988 2.5 2.7 2.7 2.9 3.1 3.2 3.3 3.5 3.5 3.7 4.3 1987 stops. Although the sampling method was not reported, we will presume that these data represent a random sample of days during the morning and evening rush hours. The NYC Transit Authority managers 1.8 1.9 2.2 attempted to improve the space problem on subway cars (more space is 2.2 better-trust us!) by adding cars to trains during the rush hours. They gathered the 1988 data to check on their efforts after one year. The data 2.4 2.3 2.1 2.1 2.1 2.2 2.2 2.8 are in the given table. 2.4 2.4 2.5 2.5 of day, they will report how far away the target value of 3 feet is relative The MTA guidelines in 1987 specified a minimum of 3 square feet per standing passenger. The engineers would like to report standardized measures (z-scores) of this target value. That is, for each year and time 2.9 Hictributions
Packed in at Rush Hour! Sq. Ft. per standing passenger Morning Morning Afternoon Afterne 1988 1.5 1.8 1.9 1.9 In 1990 the New York Times reported the average number of square feet per standing passenger in 1987 and 1988 for 19 subway 1987 2.4 2.7 2.9 3 3.1 3.6 3.6 3.6 3.7 3.8 6.7 1988 2.5 2.7 2.7 2.9 3.1 3.2 3.3 3.5 3.5 3.7 4.3 1987 stops. Although the sampling method was not reported, we will presume that these data represent a random sample of days during the morning and evening rush hours. The NYC Transit Authority managers 1.8 1.9 2.2 attempted to improve the space problem on subway cars (more space is 2.2 better-trust us!) by adding cars to trains during the rush hours. They gathered the 1988 data to check on their efforts after one year. The data 2.4 2.3 2.1 2.1 2.1 2.2 2.2 2.8 are in the given table. 2.4 2.4 2.5 2.5 of day, they will report how far away the target value of 3 feet is relative The MTA guidelines in 1987 specified a minimum of 3 square feet per standing passenger. The engineers would like to report standardized measures (z-scores) of this target value. That is, for each year and time 2.9 Hictributions

Holt Mcdougal Larson Pre-algebra: Student Edition 2012
1st Edition
ISBN:9780547587776
Author:HOLT MCDOUGAL
Publisher:HOLT MCDOUGAL
Chapter11: Data Analysis And Probability
Section11.4: Collecting Data
Problem 7E

Related questions
Question
Transcribed Image Text:Packed in at Rush Hour!
Sq. Ft. per standing passenger
Morning Morning Afternoon Afternoon
1988
2.5
2.7
2.7
2.9
3.1
3.2
3.3
3.5
3.5
3.7
4.3
5.2
5.6
5.6
6.2
11.7
13
17.3
33.3
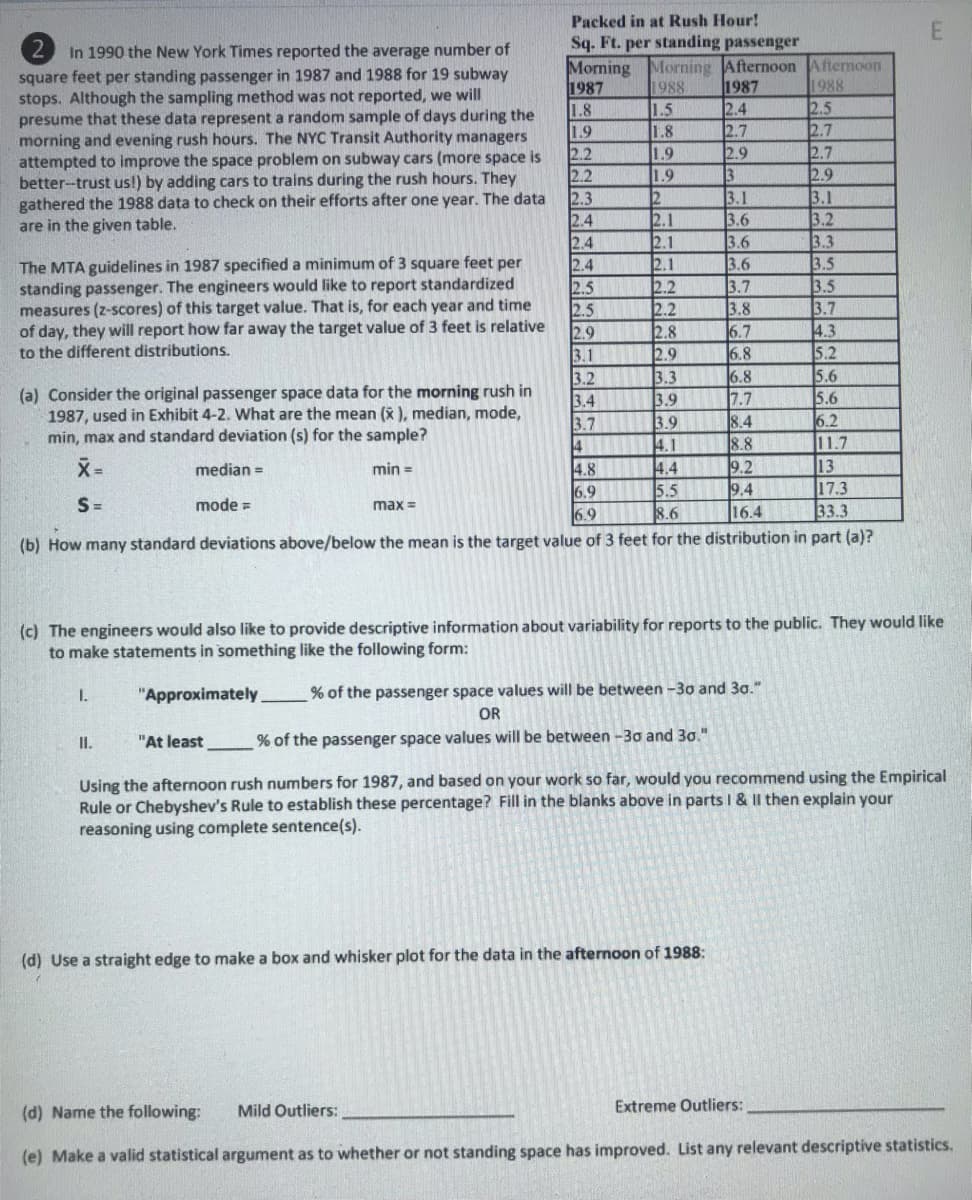
In 1990 the New York Times reported the average number of
square feet per standing passenger in 1987 and 1988 for 19 subway
stops. Although the sampling method was not reported, we will
presume that these data represent a random sample of days during the
morning and evening rush hours. The NYC Transit Authority managers
1987
2.4
2.7
2.9
3
3.1
3.6
1987
1988
1.5
1.8
1.9
1.8
1.9
2.2
2.2
2.3
attempted to improve the space problem on subway cars (more space is
1.9
better--trust us!) by adding cars to trains during the rush hours. They
gathered the 1988 data to check on their efforts after one year. The data
2.4
2.4
2.4
2.5
2.5
of day, they will report how far away the target value of 3 feet is relative
3.1
3.2
3.4
3.7
4
4.8
6.9
6.9
2.1
2.1
2.1
2.2
2.2
2.8
2.9
3.3
3.9
3.9
4.1
4.4
5.5
8.6
are in the given table.
3.6
3.6
3.7
3.8
6.7
6.8
6.8
7.7
8.4
8.8
9.2
9.4
16.4
The MTA guidelines in 1987 specified a minimum of 3 square feet per
standing passenger. The engineers would like to report standardized
measures (z-scores) of this target value. That is, for each year and time
2.9
to the different distributions.
(a) Consider the original passenger space data for the morning rush in
1987, used in Exhibit 4-2. What are the mean (x ), median, mode,
min, max and standard deviation (s) for the sample?
ヌ=
median =
min =
S =
mode =
max =
(b) How many standard deviations above/below the mean is the target value of 3 feet for the distribution in part (a)?
(c) The engineers would also like to provide descriptive information about variability for reports to the public. They would like
to make statements in something like the following form:
"Approximately.
% of the passenger space values will be between -30 and 30."
1.
OR
"At least
% of the passenger space values will be between -30 and 30."
I.
Using the afternoon rush numbers for 1987, and based on your work so far, would you recommend using the Empirical
Rule or Chebyshev's Rule to establish these percentage? Fill in the blanks above in parts I & II then explain your
reasoning using complete sentence(s).
(d) Use a straight edge to make a box and whisker plot for the data in the afternoon of 1988:
Extreme Outliers:
(d) Name the following:
Mild Outliers:
(e) Make a valid statistical argument as to whether or not standing space has improved. List any relevant descriptive statistics.
Expert Solution
This question has been solved!
Explore an expertly crafted, step-by-step solution for a thorough understanding of key concepts.

This is a popular solution!

Trending now
This is a popular solution!

Step by step
Solved in 2 steps with 1 images

Knowledge Booster


Learn more about
Need a deep-dive on the concept behind this application? Look no further. Learn more about this topic, statistics and related others by exploring similar questions and additional content below.Recommended textbooks for you
Holt Mcdougal Larson Pre-algebra: Student Edition…
Algebra
ISBN:
9780547587776
Author:
HOLT MCDOUGAL
Publisher:
HOLT MCDOUGAL


College Algebra (MindTap Course List)
Algebra
ISBN:
9781305652231
Author:
R. David Gustafson, Jeff Hughes
Publisher:
Cengage Learning
Holt Mcdougal Larson Pre-algebra: Student Edition…
Algebra
ISBN:
9780547587776
Author:
HOLT MCDOUGAL
Publisher:
HOLT MCDOUGAL
College Algebra (MindTap Course List)
Algebra
ISBN:
9781305652231
Author:
R. David Gustafson, Jeff Hughes
Publisher:
Cengage Learning