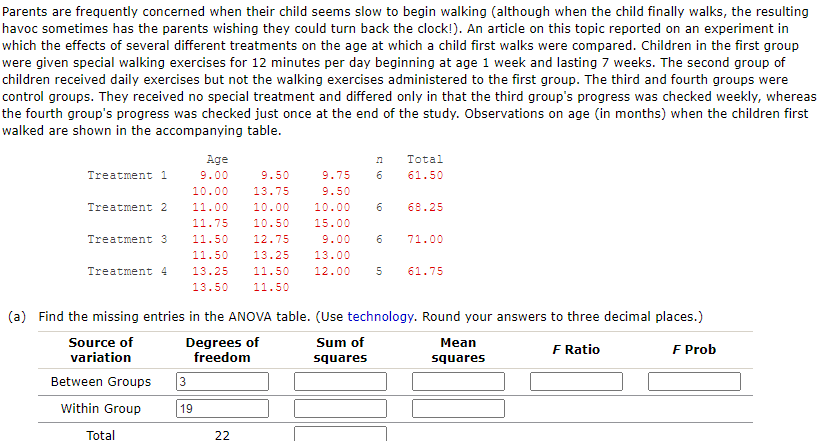
Parents are frequently concerned when their child seems slow to begin walking (although when the child finally walks, the resulting havoc sometimes has the parents wishing they could turn back the clock!). An article on this topic reported on an experiment in which the effects of several different treatments on the age at which a child first walks were compared. Children in the first group were given special walking exercises for 12 minutes per day beginning at age 1 week and lasting 7 weeks. The second group of children received daily exercises but not the walking exercises administered to the first group. The third and fourth groups were control groups. They received no special treatment and differed only in that the third group's progress was checked weekly, whereas the fourth group's progress was checked just once at the end of the study. Observations on age (in months) when the children first walked are shown in the accompanying table. Age Total Treatment 1 9.00 9.50 9.75 6 61.50 10.00 13.75 9.50 Treatment 2 11.00 10.00 10.00 6 68.25 11.75 10.50 15.00 Treatment 3 11.50 12.75 9.00 6. 71.00 11.50 13.25 13.00 Treatment 4 13.25 11.50 12.00 61.75 13.50 11.50
Parents are frequently concerned when their child seems slow to begin walking (although when the child finally walks, the resulting havoc sometimes has the parents wishing they could turn back the clock!). An article on this topic reported on an experiment in which the effects of several different treatments on the age at which a child first walks were compared. Children in the first group were given special walking exercises for 12 minutes per day beginning at age 1 week and lasting 7 weeks. The second group of children received daily exercises but not the walking exercises administered to the first group. The third and fourth groups were control groups. They received no special treatment and differed only in that the third group's progress was checked weekly, whereas the fourth group's progress was checked just once at the end of the study. Observations on age (in months) when the children first walked are shown in the accompanying table. Age Total Treatment 1 9.00 9.50 9.75 6 61.50 10.00 13.75 9.50 Treatment 2 11.00 10.00 10.00 6 68.25 11.75 10.50 15.00 Treatment 3 11.50 12.75 9.00 6. 71.00 11.50 13.25 13.00 Treatment 4 13.25 11.50 12.00 61.75 13.50 11.50

Glencoe Algebra 1, Student Edition, 9780079039897, 0079039898, 2018
18th Edition
ISBN:9780079039897
Author:Carter
Publisher:Carter
Chapter10: Statistics
Section10.1: Measures Of Center
Problem 9PPS

Related questions
Question
16.1#8
State the test statistic and P-value. (Use technology. Round your answers to three decimal places.)
F=P-value=
Transcribed Image Text:Parents are frequently concerned when their child seems slow to begin walking (although when the child finally walks, the resulting
havoc sometimes has the parents wishing they could turn back the clock!). An article on this topic reported on an experiment in
which the effects of several different treatments on the age at which a child first walks were compared. Children in the first group
were given special walking exercises for 12 minutes per day beginning at age 1 week and lasting 7 weeks. The second group of
children received daily exercises but not the walking exercises administered to the first group. The third and fourth groups were
control groups. They received no special treatment and differed only in that the third group's progress was checked weekly, whereas
the fourth group's progress was checked just once at the end of the study. Observations on age (in months) when the children first
walked are shown in the accompanying table.
Age
Total
Treatment 1
9.00
9.50
9.75
61.50
10.00
13.75
9.50
Treatment 2
11.00
10.00
10.00
68.25
11.75
10.50
15.00
Treatment 3
11.50
12.75
9.00
71.00
11.50
13.25
13.00
Treatment 4
13.25
11.50
12.00
61.75
13.50
11.50
(a) Find the missing entries in the ANOVA table. (Use technology. Round your answers to three decimal places.)
Source of
variation
Degrees of
freedom
Sum of
Mean
F Ratio
F Prob
squares
squares
Between Groups
Within Group
19
Total
22
Expert Solution
This question has been solved!
Explore an expertly crafted, step-by-step solution for a thorough understanding of key concepts.

Step by step
Solved in 2 steps with 1 images

Knowledge Booster


Learn more about
Need a deep-dive on the concept behind this application? Look no further. Learn more about this topic, statistics and related others by exploring similar questions and additional content below.Recommended textbooks for you
Glencoe Algebra 1, Student Edition, 9780079039897…
Algebra
ISBN:
9780079039897
Author:
Carter
Publisher:
McGraw Hill

Trigonometry (MindTap Course List)
Trigonometry
ISBN:
9781337278461
Author:
Ron Larson
Publisher:
Cengage Learning
Glencoe Algebra 1, Student Edition, 9780079039897…
Algebra
ISBN:
9780079039897
Author:
Carter
Publisher:
McGraw Hill
Trigonometry (MindTap Course List)
Trigonometry
ISBN:
9781337278461
Author:
Ron Larson
Publisher:
Cengage Learning