PART 1: Analysis of CHIS Data (data available on Blackboard). You will need SPSS to open the data set. This is a CHIS data on California Teen's health for 2013. 1. Look through the data set (TEEN.sav) and pick at least 2 variables you would like to test. 2. Write a null and research hypothesis for the variables. 3. Identify the variables measurement level (e.g. nominal, ordinal, ratio, and or interval). 4. Based on how your variables were measured, pick a couple of tests we have covered in the class and run your analysis (use the 'Tests' excel provided under lecture to help you choose the appropriate tests to run). Also include graphs in your analysis. 5. Interpret your analysis and tables. To run any statistical test, remember, you would need at least 2 variables (you can also run multiple variables), you have free reign on which variables you want to test from the data available on Blackboard. 6: Conclusions: Using the 10 steps for testing hypotheses (list all the ten steps and provide the answer under each), determine if the null hypothesis can be rejected or fail to be rejected. 1:34PM Wed Apr 24 TEEN_1.csv 64% Done 3 1 2 19.14 1 1 ACMDMT_P1 AGEGPA_P1 AHEDTC_P1 ASTCUR BMI_P CITIZEN2 DOCT_YR DSTRSTN_P1 ER FAMSIZE2_P1 FAMT4 FPG FV5DAY HGHTI_P HGHTM_P HHSIZE_P1 HMO HSSTUD IAP2 INS INS12M INS64 IN 25 5 6 61 3 1 2 1.54 5 2 -1 1 1 12 2 3 1 3 7 2 19.89 1 1 4 24 3 3 2 64 1.62 4 2 -1 -1 1 12 5 3 1 1 9 2 21.52 1 1 10 2 5 3 3 2 63 1.59 5 1 1 -1 1 12 5 3 1 1 1 2 23.68 1 1 8 4 4 3 2 59 1.51 5 2 1 1 1 12 2 3 1 3 3 2 22.77 1 1 7 2 5 3 2 2 66 1.67 6 1 -1 2 1 12 3 3 1 4 1 2 20.66 1 1 0 2 3 3 4 2 67 1.69 3 2 1 -1 1 12 5 3 3 3 1 2 18.89 1 1 10 2 7 3 1 2 47 1.2 8 1 -1 1 1 12 2 3 1 3 7 2 22.35 1 1 0 2 3 3 4 1 61 1.56 3 2 1 -1 1 12 5 3 1 1 1 2 35.79 3 1 5 2 4 4 1 2 59 1.51 5 3 1 2 2 0 1 1 1 1 6 2 20.73 1 1 7 2 6 3 3 2 64 1.62 5 3 1 -1 2 0 1 1 2 4 7 2 28.67 1 1 0 2 4 3 4 2 65 1.64 5 3 -1 -1 2 0 1 1 2 3 1 2 18.21 3 1 1 2 4 3 2 1 53 1.34 5 1 -1 2 1 12 2 3 2 3 9 2 15.14 1 1 4 1 3 3 4 2 70 1.79 3 1 1 -1 1 12 5 3 0 4 7 2 25.16 1 2 0 2 3 4 4 2 45 1.14 2 2 -1 -1 1 12 5 3 1 4 7 2 17.3 1 1 2 2 4 4 1 64 1.62 3 1 -1 -1 1 12 5 3 1 4 9 2 17.7 1 1 3 2 4 3 4 1 65 1.64 5 1 1 -1 1 12 5 3 0 5 1 2 23.86 1 2 2 2 2 4 3 2 59 1.51 2 1 1 1 1 12 2 3 1 1 1 2 16.23 1 1 1 26 3 1 2 64 1.62 4 2 -1 2 1 9 2 2 1 1 3 2 23.59 1 1 5 2 8 3 2 2 66 1.67 2 1 2 12 5 3 2 3 7 2 25.75 1 1 5 1 4 3 3 2 72 1.82 5 2 1 2 1 12 5 3 0 4 6 1 20.65 1 2 0 2 4 3 4 2 63 1.59 4 1 -1 2 1 12 5 3 0 4 2 2 22.46 1 2 2 25 3 1 2 69 1.74 7 2 1 1 1 12 2 3 0 4 9 1 25.91 1 2 4 2 3 3 4 1 64 1.62 4 2 -1 -1 1 12 5 3 2 3 7 1 20.23 1 1 2 2 3 3 4 2 64 1.62 3 2 1 -1 1 12 5 3 1 2 2 19.1 3 1 4 1 5 4 1 2 70 1.79 5 1 1 2 1 12 6 3 3 2 25.42 1 2 4 3 3 67 1.69 8 2 1 -1 1 12 5 3 6 3 3 2 24.71 1 1 1 2 4 3 4 2 69 1.74 1 1 -1 1 12 5 3 3 3 9 2 19.01 1 1 7 1 5 3 3 2 64 1.62 6 1 1 -1 1 12 5 3 2 7 1 21.16 1 1 2 A 66 1.67 3 2 1 -1 1 12 5 3
PART 1: Analysis of CHIS Data (data available on Blackboard). You will need SPSS to open the data set. This is a CHIS data on California Teen's health for 2013. 1. Look through the data set (TEEN.sav) and pick at least 2 variables you would like to test. 2. Write a null and research hypothesis for the variables. 3. Identify the variables measurement level (e.g. nominal, ordinal, ratio, and or interval). 4. Based on how your variables were measured, pick a couple of tests we have covered in the class and run your analysis (use the 'Tests' excel provided under lecture to help you choose the appropriate tests to run). Also include graphs in your analysis. 5. Interpret your analysis and tables. To run any statistical test, remember, you would need at least 2 variables (you can also run multiple variables), you have free reign on which variables you want to test from the data available on Blackboard. 6: Conclusions: Using the 10 steps for testing hypotheses (list all the ten steps and provide the answer under each), determine if the null hypothesis can be rejected or fail to be rejected. 1:34PM Wed Apr 24 TEEN_1.csv 64% Done 3 1 2 19.14 1 1 ACMDMT_P1 AGEGPA_P1 AHEDTC_P1 ASTCUR BMI_P CITIZEN2 DOCT_YR DSTRSTN_P1 ER FAMSIZE2_P1 FAMT4 FPG FV5DAY HGHTI_P HGHTM_P HHSIZE_P1 HMO HSSTUD IAP2 INS INS12M INS64 IN 25 5 6 61 3 1 2 1.54 5 2 -1 1 1 12 2 3 1 3 7 2 19.89 1 1 4 24 3 3 2 64 1.62 4 2 -1 -1 1 12 5 3 1 1 9 2 21.52 1 1 10 2 5 3 3 2 63 1.59 5 1 1 -1 1 12 5 3 1 1 1 2 23.68 1 1 8 4 4 3 2 59 1.51 5 2 1 1 1 12 2 3 1 3 3 2 22.77 1 1 7 2 5 3 2 2 66 1.67 6 1 -1 2 1 12 3 3 1 4 1 2 20.66 1 1 0 2 3 3 4 2 67 1.69 3 2 1 -1 1 12 5 3 3 3 1 2 18.89 1 1 10 2 7 3 1 2 47 1.2 8 1 -1 1 1 12 2 3 1 3 7 2 22.35 1 1 0 2 3 3 4 1 61 1.56 3 2 1 -1 1 12 5 3 1 1 1 2 35.79 3 1 5 2 4 4 1 2 59 1.51 5 3 1 2 2 0 1 1 1 1 6 2 20.73 1 1 7 2 6 3 3 2 64 1.62 5 3 1 -1 2 0 1 1 2 4 7 2 28.67 1 1 0 2 4 3 4 2 65 1.64 5 3 -1 -1 2 0 1 1 2 3 1 2 18.21 3 1 1 2 4 3 2 1 53 1.34 5 1 -1 2 1 12 2 3 2 3 9 2 15.14 1 1 4 1 3 3 4 2 70 1.79 3 1 1 -1 1 12 5 3 0 4 7 2 25.16 1 2 0 2 3 4 4 2 45 1.14 2 2 -1 -1 1 12 5 3 1 4 7 2 17.3 1 1 2 2 4 4 1 64 1.62 3 1 -1 -1 1 12 5 3 1 4 9 2 17.7 1 1 3 2 4 3 4 1 65 1.64 5 1 1 -1 1 12 5 3 0 5 1 2 23.86 1 2 2 2 2 4 3 2 59 1.51 2 1 1 1 1 12 2 3 1 1 1 2 16.23 1 1 1 26 3 1 2 64 1.62 4 2 -1 2 1 9 2 2 1 1 3 2 23.59 1 1 5 2 8 3 2 2 66 1.67 2 1 2 12 5 3 2 3 7 2 25.75 1 1 5 1 4 3 3 2 72 1.82 5 2 1 2 1 12 5 3 0 4 6 1 20.65 1 2 0 2 4 3 4 2 63 1.59 4 1 -1 2 1 12 5 3 0 4 2 2 22.46 1 2 2 25 3 1 2 69 1.74 7 2 1 1 1 12 2 3 0 4 9 1 25.91 1 2 4 2 3 3 4 1 64 1.62 4 2 -1 -1 1 12 5 3 2 3 7 1 20.23 1 1 2 2 3 3 4 2 64 1.62 3 2 1 -1 1 12 5 3 1 2 2 19.1 3 1 4 1 5 4 1 2 70 1.79 5 1 1 2 1 12 6 3 3 2 25.42 1 2 4 3 3 67 1.69 8 2 1 -1 1 12 5 3 6 3 3 2 24.71 1 1 1 2 4 3 4 2 69 1.74 1 1 -1 1 12 5 3 3 3 9 2 19.01 1 1 7 1 5 3 3 2 64 1.62 6 1 1 -1 1 12 5 3 2 7 1 21.16 1 1 2 A 66 1.67 3 2 1 -1 1 12 5 3

Glencoe Algebra 1, Student Edition, 9780079039897, 0079039898, 2018
18th Edition
ISBN:9780079039897
Author:Carter
Publisher:Carter
Chapter10: Statistics
Section: Chapter Questions
Problem 25SGR

Related questions
Question
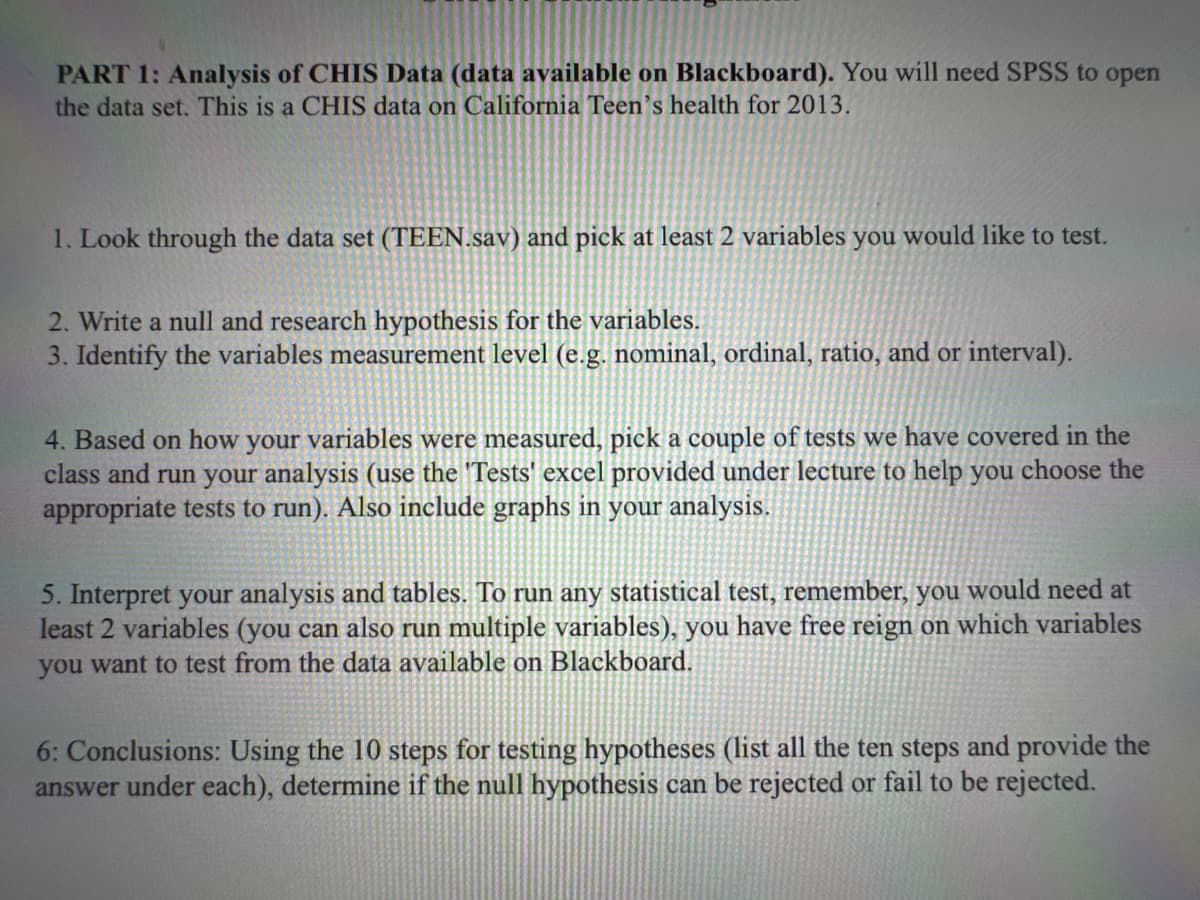
Transcribed Image Text:PART 1: Analysis of CHIS Data (data available on Blackboard). You will need SPSS to open
the data set. This is a CHIS data on California Teen's health for 2013.
1. Look through the data set (TEEN.sav) and pick at least 2 variables you would like to test.
2. Write a null and research hypothesis for the variables.
3. Identify the variables measurement level (e.g. nominal, ordinal, ratio, and or interval).
4. Based on how your variables were measured, pick a couple of tests we have covered in the
class and run your analysis (use the 'Tests' excel provided under lecture to help you choose the
appropriate tests to run). Also include graphs in your analysis.
5. Interpret your analysis and tables. To run any statistical test, remember, you would need at
least 2 variables (you can also run multiple variables), you have free reign on which variables
you want to test from the data available on Blackboard.
6: Conclusions: Using the 10 steps for testing hypotheses (list all the ten steps and provide the
answer under each), determine if the null hypothesis can be rejected or fail to be rejected.
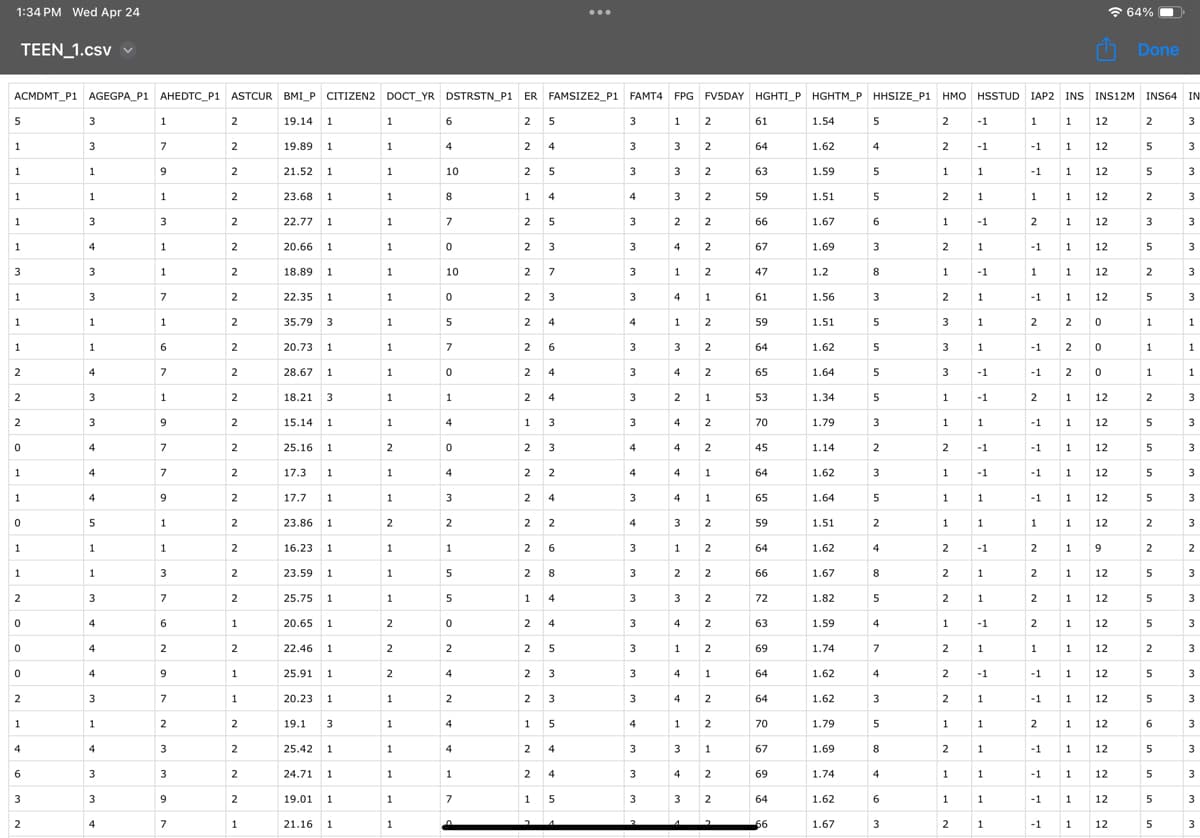
Transcribed Image Text:1:34PM Wed Apr 24
TEEN_1.csv
64%
Done
3
1
2
19.14
1
1
ACMDMT_P1 AGEGPA_P1 AHEDTC_P1 ASTCUR BMI_P CITIZEN2 DOCT_YR DSTRSTN_P1 ER FAMSIZE2_P1 FAMT4 FPG FV5DAY HGHTI_P HGHTM_P HHSIZE_P1 HMO HSSTUD IAP2 INS INS12M INS64 IN
25
5
6
61
3
1 2
1.54
5
2
-1
1
1
12
2
3
1
3
7
2
19.89 1
1
4
24
3
3 2
64
1.62
4
2
-1
-1
1 12
5
3
1
1
9
2
21.52
1
1
10
2
5
3
3
2
63
1.59
5
1
1
-1
1
12
5
3
1
1
1
2
23.68
1
1
8
4
4
3
2
59
1.51
5
2
1
1
1
12
2
3
1
3
3
2
22.77
1
1
7
2
5
3
2
2
66
1.67
6
1
-1
2
1
12
3
3
1
4
1
2
20.66
1
1
0
2
3
3
4
2
67
1.69
3
2
1
-1
1
12
5
3
3
3
1
2
18.89
1
1
10
2
7
3
1
2
47
1.2
8
1
-1
1
1
12
2
3
1
3
7
2
22.35
1
1
0
2
3
3
4
1
61
1.56
3
2
1
-1
1
12
5
3
1
1
1
2
35.79
3
1
5
2
4
4
1
2
59
1.51
5
3
1
2
2
0
1
1
1
1
6
2
20.73
1
1
7
2
6
3
3
2
64
1.62
5
3
1
-1
2
0
1
1
2
4
7
2
28.67
1
1
0
2
4
3
4
2
65
1.64
5
3
-1
-1
2
0
1
1
2
3
1
2
18.21
3
1
1
2
4
3
2
1
53
1.34
5
1
-1
2
1
12
2
3
2
3
9
2
15.14 1
1
4
1
3
3
4
2
70
1.79
3
1
1
-1
1
12
5
3
0
4
7
2
25.16 1
2
0
2
3
4
4
2
45
1.14
2
2
-1
-1
1
12
5
3
1
4
7
2
17.3
1
1
2
2
4
4
1
64
1.62
3
1
-1
-1
1
12
5
3
1
4
9
2
17.7
1
1
3
2
4
3
4
1
65
1.64
5
1
1
-1
1
12
5
3
0
5
1
2
23.86
1
2
2
2
2
4
3
2
59
1.51
2
1
1
1
1
12
2
3
1
1
1
2
16.23
1
1
1
26
3
1
2
64
1.62
4
2
-1
2
1
9
2
2
1
1
3
2
23.59
1
1
5
2
8
3
2
2
66
1.67
2
1
2
12
5
3
2
3
7
2
25.75
1
1
5
1
4
3
3
2
72
1.82
5
2
1
2
1
12
5
3
0
4
6
1
20.65 1
2
0
2
4
3
4
2
63
1.59
4
1
-1
2
1
12
5
3
0
4
2
2
22.46 1
2
2
25
3
1
2
69
1.74
7
2
1
1
1
12
2
3
0
4
9
1
25.91
1
2
4
2
3
3
4
1
64
1.62
4
2
-1
-1
1
12
5
3
2
3
7
1
20.23
1
1
2
2
3
3
4
2
64
1.62
3
2
1
-1
1
12
5
3
1
2
2
19.1
3
1
4
1
5
4
1
2
70
1.79
5
1
1
2
1
12
6
3
3
2
25.42 1
2
4
3
3
67
1.69
8
2
1
-1
1
12
5
3
6
3
3
2
24.71 1
1
1
2
4
3
4
2
69
1.74
1
1
-1
1
12
5
3
3
3
9
2
19.01
1
1
7
1
5
3
3
2
64
1.62
6
1
1
-1
1
12
5
3
2
7
1
21.16
1
1
2
A
66
1.67
3
2
1
-1
1
12
5
3
Expert Solution
This question has been solved!
Explore an expertly crafted, step-by-step solution for a thorough understanding of key concepts.

Step by step
Solved in 2 steps

Recommended textbooks for you
Glencoe Algebra 1, Student Edition, 9780079039897…
Algebra
ISBN:
9780079039897
Author:
Carter
Publisher:
McGraw Hill

Big Ideas Math A Bridge To Success Algebra 1: Stu…
Algebra
ISBN:
9781680331141
Author:
HOUGHTON MIFFLIN HARCOURT
Publisher:
Houghton Mifflin Harcourt

Holt Mcdougal Larson Pre-algebra: Student Edition…
Algebra
ISBN:
9780547587776
Author:
HOLT MCDOUGAL
Publisher:
HOLT MCDOUGAL
Glencoe Algebra 1, Student Edition, 9780079039897…
Algebra
ISBN:
9780079039897
Author:
Carter
Publisher:
McGraw Hill
Big Ideas Math A Bridge To Success Algebra 1: Stu…
Algebra
ISBN:
9781680331141
Author:
HOUGHTON MIFFLIN HARCOURT
Publisher:
Houghton Mifflin Harcourt
Holt Mcdougal Larson Pre-algebra: Student Edition…
Algebra
ISBN:
9780547587776
Author:
HOLT MCDOUGAL
Publisher:
HOLT MCDOUGAL