Part 1 Fill in the missing values in the table. Round your responses for the expected frequencies to two or more decimal places. Round your responses to fE three or more decimal places. Send data to Excel In a church Indoors but not in a church Outdoors Total Observed frequency 167 70 43 280 fo Expected frequency 56.00 fn
Part 1 Fill in the missing values in the table. Round your responses for the expected frequencies to two or more decimal places. Round your responses to fE three or more decimal places. Send data to Excel In a church Indoors but not in a church Outdoors Total Observed frequency 167 70 43 280 fo Expected frequency 56.00 fn

Holt Mcdougal Larson Pre-algebra: Student Edition 2012
1st Edition
ISBN:9780547587776
Author:HOLT MCDOUGAL
Publisher:HOLT MCDOUGAL
Chapter11: Data Analysis And Probability
Section11.5: Interpreting Data
Problem 1C

Related questions

Topic Video
Question
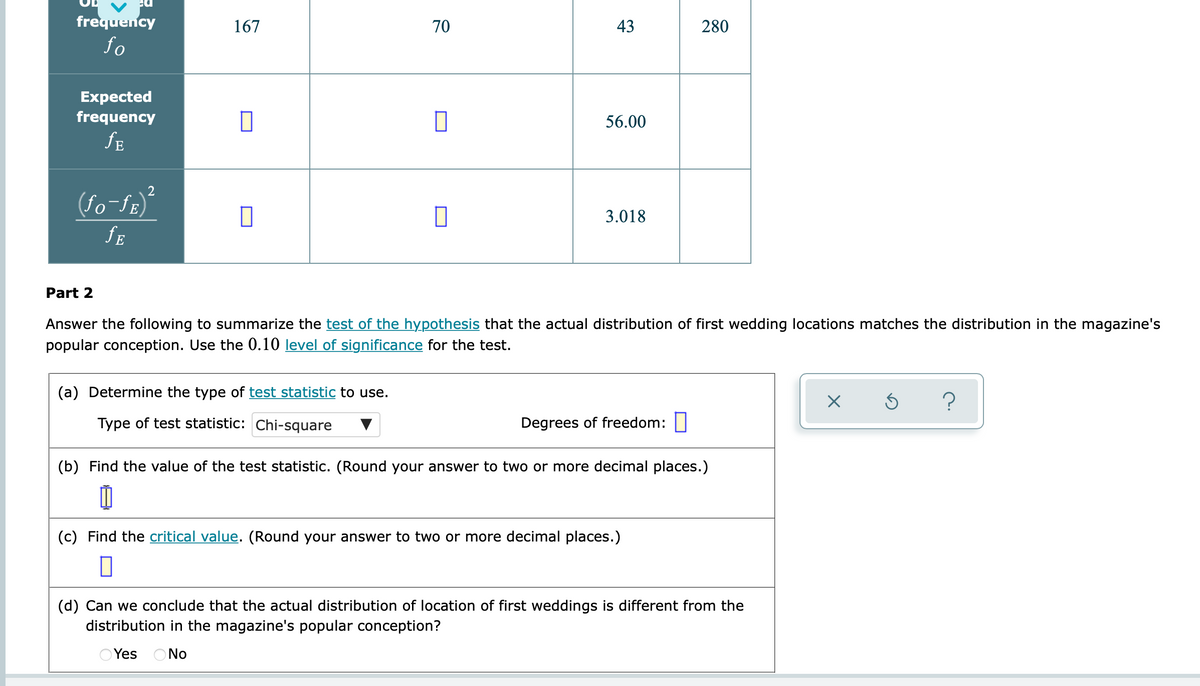
Transcribed Image Text:frequency
167
70
43
280
fo
Expected
frequency
56.00
fE
fo-fE)
3.018
fE
Part 2
Answer the following to summarize the test of the hypothesis that the actual distribution of first wedding locations matches the distribution in the magazine's
popular conception. Use the 0.10 level of significance for the test.
(a) Determine the type of test statistic to use.
Type of test statistic: Chi-square
Degrees of freedom:|
(b) Find the value of the test statistic. (Round your answer to two or more decimal places.)
(c) Find the critical value. (Round your answer to two or more decimal places.)
(d) Can we conclude that the actual distribution of location of first weddings is different from the
distribution in the magazine's popular conception?
OYes ONo
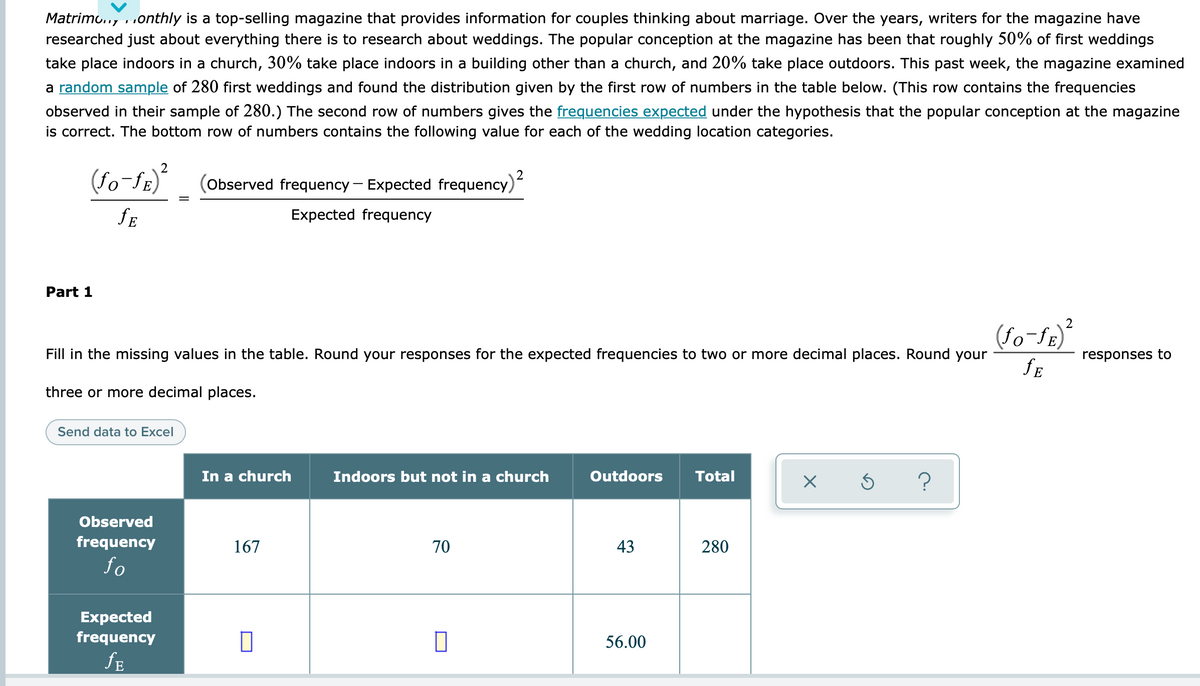
Transcribed Image Text:Matrimo.., ..onthly is a top-selling magazine that provides information for couples thinking about marriage. Over the years, writers for the magazine have
researched just about everything there is to research about weddings. The popular conception at the magazine has been that roughly 50% of first weddings
take place indoors in a church, 30% take place indoors in a building other than a church, and 20% take place outdoors. This past week, the magazine examined
a random sample of 280 first weddings and found the distribution given by the first row of numbers in the table below. (This row contains the frequencies
observed in their sample of 280.) The second row of numbers gives the frequencies expected under the hypothesis that the popular conception at the magazine
is correct. The bottom row of numbers contains the following value for each of the wedding location categories.
2
(Observed frequency – Expected frequency)
Expected frequency
Part 1
(fo-fE)
Fill in the missing values in the table. Round your responses for the expected frequencies to two or more decimal places. Round your
responses to
fE
three or more decimal places.
Send data to Excel
In a church
Indoors but not in a church
Outdoors
Total
Observed
frequency
167
70
43
280
fo
Expected
frequency
56.00
fE
Expert Solution
This question has been solved!
Explore an expertly crafted, step-by-step solution for a thorough understanding of key concepts.

This is a popular solution!

Trending now
This is a popular solution!

Step by step
Solved in 2 steps

Knowledge Booster


Learn more about
Need a deep-dive on the concept behind this application? Look no further. Learn more about this topic, statistics and related others by exploring similar questions and additional content below.Recommended textbooks for you
Holt Mcdougal Larson Pre-algebra: Student Edition…
Algebra
ISBN:
9780547587776
Author:
HOLT MCDOUGAL
Publisher:
HOLT MCDOUGAL

Glencoe Algebra 1, Student Edition, 9780079039897…
Algebra
ISBN:
9780079039897
Author:
Carter
Publisher:
McGraw Hill
Holt Mcdougal Larson Pre-algebra: Student Edition…
Algebra
ISBN:
9780547587776
Author:
HOLT MCDOUGAL
Publisher:
HOLT MCDOUGAL
Glencoe Algebra 1, Student Edition, 9780079039897…
Algebra
ISBN:
9780079039897
Author:
Carter
Publisher:
McGraw Hill