Part 3 of 4 Step 3: Find the p-value of the test statistic. %3D ANOVA Table SS df MS F Between Within P(F2v
Part 3 of 4 Step 3: Find the p-value of the test statistic. %3D ANOVA Table SS df MS F Between Within P(F2v

Glencoe Algebra 1, Student Edition, 9780079039897, 0079039898, 2018
18th Edition
ISBN:9780079039897
Author:Carter
Publisher:Carter
Chapter4: Equations Of Linear Functions
Section: Chapter Questions
Problem 8SGR

Related questions
Question
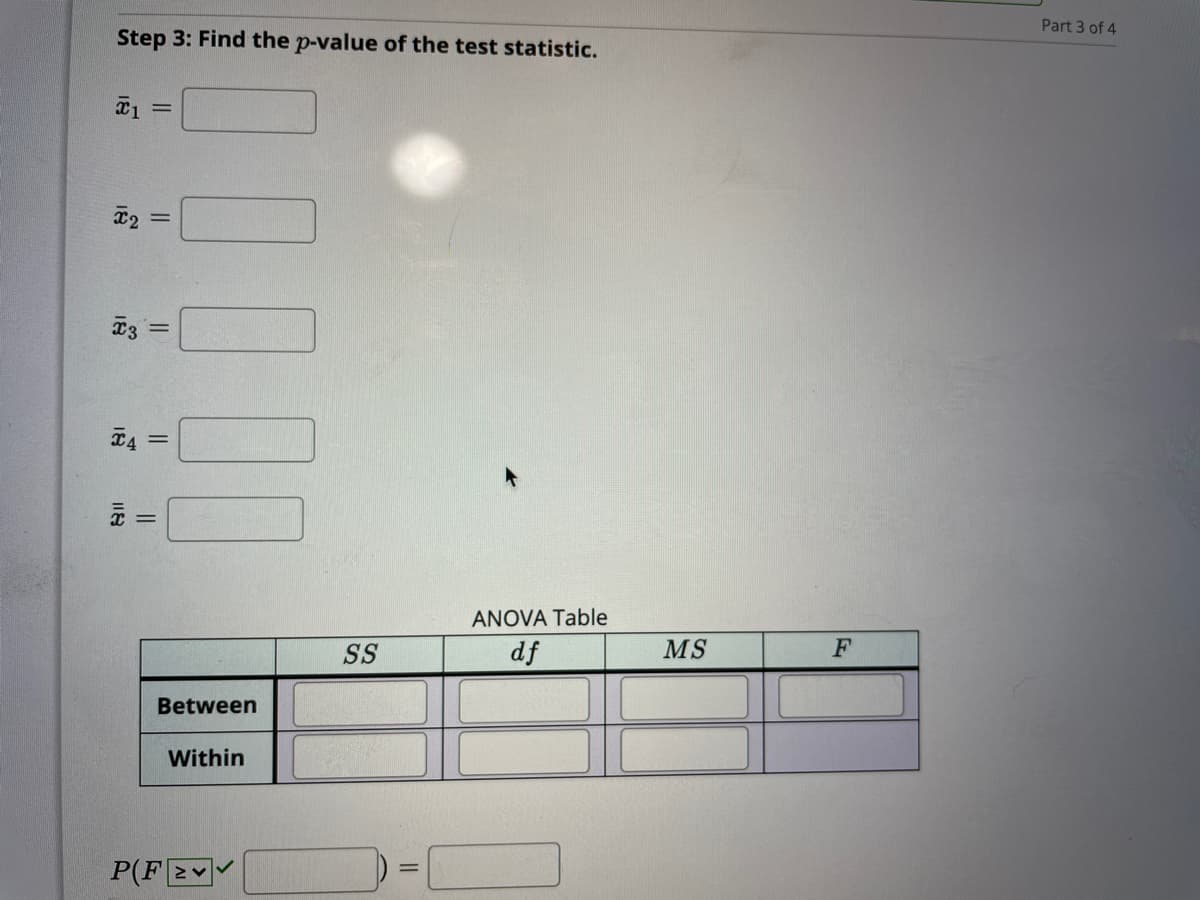
Transcribed Image Text:Part 3 of 4
Step 3: Find the p-value of the test statistic.
x2
x3 =
T4 :
ANOVA Table
SS
df
MS
F
Between
Within
P(F2
||
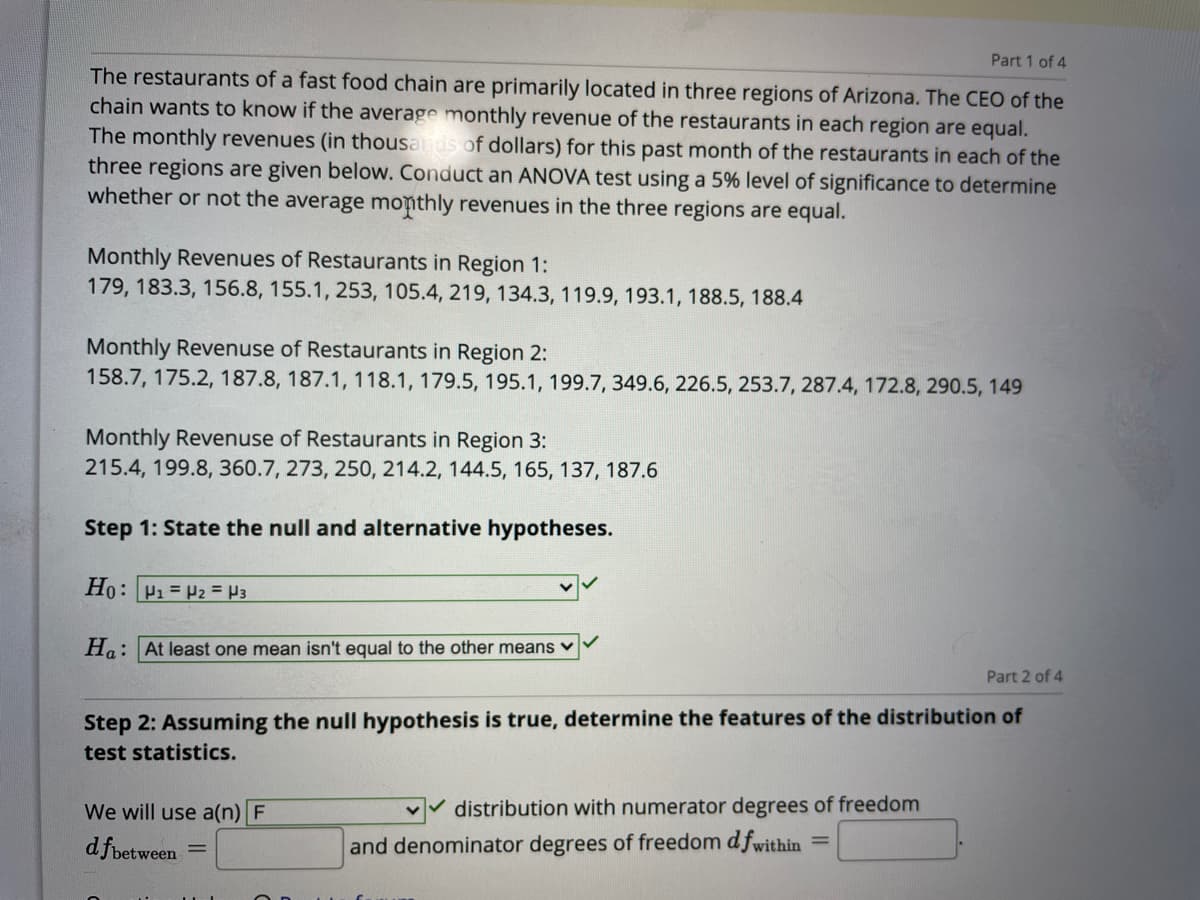
Transcribed Image Text:Part 1 of 4
The restaurants of a fast food chain are primarily located in three regions of Arizona. The CEO of the
chain wants to know if the average monthly revenue of the restaurants in each region are equal.
The monthly revenues (in thousads of dollars) for this past month of the restaurants in each of the
three regions are given below. Conduct an ANOVA test using a 5% level of significance to determine
whether or not the average monthly revenues in the three regions are equal.
Monthly Revenues of Restaurants in Region 1:
179, 183.3, 156.8, 155.1, 253, 105.4, 219, 134.3, 119.9, 193.1, 188.5, 188.4
Monthly Revenuse of Restaurants in Region 2:
158.7, 175.2, 187.8, 187.1, 118.1, 179.5, 195.1, 199.7, 349.6, 226.5, 253.7, 287.4, 172.8, 290.5, 149
Monthly Revenuse of Restaurants in Region 3:
215.4, 199.8, 360.7, 273, 250, 214.2, 144.5, 165, 137, 187.6
Step 1: State the null and alternative hypotheses.
Ho: P1 = P2 = H3
Ha: At least one mean isn't equal to the other means v
Part 2 of 4
Step 2: Assuming the null hypothesis is true, determine the features of the distribution of
test statistics.
We will use a(n) F
distribution with numerator degrees of freedom
d fbetween
and denominator degrees of freedom d fwithin =
Expert Solution
This question has been solved!
Explore an expertly crafted, step-by-step solution for a thorough understanding of key concepts.

Step by step
Solved in 2 steps with 1 images

Knowledge Booster


Learn more about
Need a deep-dive on the concept behind this application? Look no further. Learn more about this topic, statistics and related others by exploring similar questions and additional content below.Recommended textbooks for you
Glencoe Algebra 1, Student Edition, 9780079039897…
Algebra
ISBN:
9780079039897
Author:
Carter
Publisher:
McGraw Hill

College Algebra (MindTap Course List)
Algebra
ISBN:
9781305652231
Author:
R. David Gustafson, Jeff Hughes
Publisher:
Cengage Learning

Glencoe Algebra 1, Student Edition, 9780079039897…
Algebra
ISBN:
9780079039897
Author:
Carter
Publisher:
McGraw Hill
College Algebra (MindTap Course List)
Algebra
ISBN:
9781305652231
Author:
R. David Gustafson, Jeff Hughes
Publisher:
Cengage Learning