Part A The next questions are in relation to recent study of house prices in Sydney. The variables investigated are: 1 SalePrice Selling Price in Thousands of dollars 2 Distance Distance from Sydney CBD in Kilometers 3 LandSize Land size in square meters 4 Building Area Building Area Construction in square meters Research Question: Is there a relation between Price of the house and land size? The output below presents the relation between Price of the house (in thousands of dollars) and land size.The >results1 <- lm(SalePrice ~ LandSize) >results1 Call: lm(formula = SalePrice ~ LandSize) Coefficients: (Intercept) LandSize 493.4233 1.5821 >summary(results1) Call: lm(formula = SalePrice ~ LandSize) Coefficients: Estimate Std. Error t value Pr(>|t|) (Intercept) 493.42 119.47 4.13 0.0001 LandSize 1.5821 0.1926 **** ***** Residual standard error: 483.86 on 182 degrees of freedom Multiple R-squared: 0.52, Adjusted R-squared: 0.2665 - What is the p-value? What is the correct decision for this test? (Choose one from below) -Since p-value < 0.05, do not reject H0 -Since p-value < 0.05, reject H0 -Since p-value > 0.05, do not reject H0 -Since p-value > 0.05, reject H0 -An appropriate conclusion for this test is: (Choose one from below) -There is a significant positive linear relation between PS and LS and If PS increases by 1 unit, we expect LS to increase by 1.58 units, on average. -There is a significant negative linear relation between PS and LS and If LS increases by 1 unit, we expect PS to increase by 1.58 dollars, on average. -There is a significant positive linear relation between SP and LS and If LS increases by 1 unit, we expect PS to increase by 493.42 dollars, on average. -There is a significant positive linear relation between SP and LS and If LS increases by 1 unit, we expect SP to increase by 1.58 dollars, on average. - Calculate the value of the correlation coefficient? (2 decimal places) = - How would you interpret the correlation coefficient. (Choose one from below) -There is a very strong negative linear relation between PS and LS -There is a moderate strong positive linear relation between PS and LS -There is a very strong positive non-linear relation between PS and LS -There is a very strong negative non-linear relation between PS and LS -There is a weak positive linear relation between PS and LS - Can we use the regression to predict LS when PS is 1500? (Choose one from below) -Yes, we can make prediction as the value 1500 is within the range of the data. -No, we can only predict PS from LS no the other way round. -No, because we did not reject the null hypothesis - No, we can't make prediction as there is no linear relation. - Predict the PS if LS is 450. ( 2 decimal places) =


Part A
The next questions are in relation to recent study of house prices in Sydney. The variables investigated are:
1 SalePrice Selling Price in Thousands of dollars
2 Distance Distance from Sydney CBD in Kilometers
3 LandSize Land size in square meters
4 Building Area Building Area Construction in square meters
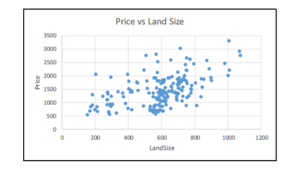
Research Question: Is there a relation between Price of the house and land size?
The output below presents the relation between Price of the house (in thousands of dollars) and land size.The
>results1 <- lm(SalePrice ~ LandSize)
>results1
Call: lm(formula = SalePrice ~ LandSize)
Coefficients:
(Intercept) LandSize
493.4233 1.5821
>summary(results1)
Call: lm(formula = SalePrice ~ LandSize)
Coefficients:
Estimate Std. Error t value Pr(>|t|)
(Intercept) 493.42 119.47 4.13 0.0001
LandSize 1.5821 0.1926 **** *****
Residual standard error: 483.86 on 182 degrees of freedom
Multiple R-squared: 0.52, Adjusted R-squared: 0.2665
- What is the p-value? What is the correct decision for this test? (Choose one from below)
-An appropriate conclusion for this test is: (Choose one from below)
- Calculate the value of the
=
- How would you interpret the correlation coefficient. (Choose one from below)
- Can we use the regression to predict LS when PS is 1500? (Choose one from below)
- Predict the PS if LS is 450. ( 2 decimal places)
=

Step by step
Solved in 4 steps


