PART B (b)How many of the 90% confidence intervals constructed from the 20 samples contain the population mean, μ =100 ? ANSWER _____ PART C (c)Choose ALL that are true. ___ For each sample, the 75% confidence interval for the sample is included in the 90% confidence interval for the sample. ____ We would expect to find more 75% confidence intervals that contain the population mean than 90% confidence intervals that contain the population mean. Given a sample, a higher confidence level results in a narrower interval. ___ It is not surprising that some 75% confidence intervals are different from other 75% confidence intervals. Each confidence interval depends on its sample, and different samples may give different confidence intervals. ___ The sample means for Sample 19 and Sample 20 are different, so the center of the 90% confidence interval for Sample 19 is different from the center of the 90% confidence interval for Sample 20. ____ None of the choices above are true
PART B (b)How many of the 90% confidence intervals constructed from the 20 samples contain the population mean, μ =100 ? ANSWER _____ PART C (c)Choose ALL that are true. ___ For each sample, the 75% confidence interval for the sample is included in the 90% confidence interval for the sample. ____ We would expect to find more 75% confidence intervals that contain the population mean than 90% confidence intervals that contain the population mean. Given a sample, a higher confidence level results in a narrower interval. ___ It is not surprising that some 75% confidence intervals are different from other 75% confidence intervals. Each confidence interval depends on its sample, and different samples may give different confidence intervals. ___ The sample means for Sample 19 and Sample 20 are different, so the center of the 90% confidence interval for Sample 19 is different from the center of the 90% confidence interval for Sample 20. ____ None of the choices above are true

MATLAB: An Introduction with Applications
6th Edition
ISBN:9781119256830
Author:Amos Gilat
Publisher:Amos Gilat
Chapter1: Starting With Matlab
Section: Chapter Questions
Problem 1P

Related questions
Question
PART B
(b)How many of the 90% confidence intervals constructed from the 20 samples contain the population mean ,
μ =100 ? ANSWER _____
PART C
(c)Choose ALL that are true.
___ For each sample, the 75% confidence interval for the sample is included in the 90% confidence interval for the sample.
____ We would expect to find more 75% confidence intervals that contain the population mean than 90%
confidence intervals that contain the population mean. Given a sample, a higher confidence level results in a narrower interval.
___ It is not surprising that some 75% confidence intervals are different from other 75% confidence intervals. Each confidence interval depends on its sample, and different samples may give different confidence intervals.
___ The sample means for Sample 19 and Sample 20 are different, so the center of the 90% confidence interval for Sample 19 is different from the center of the 90% confidence interval for Sample 20.
____ None of the choices above are true
confidence intervals that contain the population mean. Given a sample, a higher confidence level results in a narrower interval.
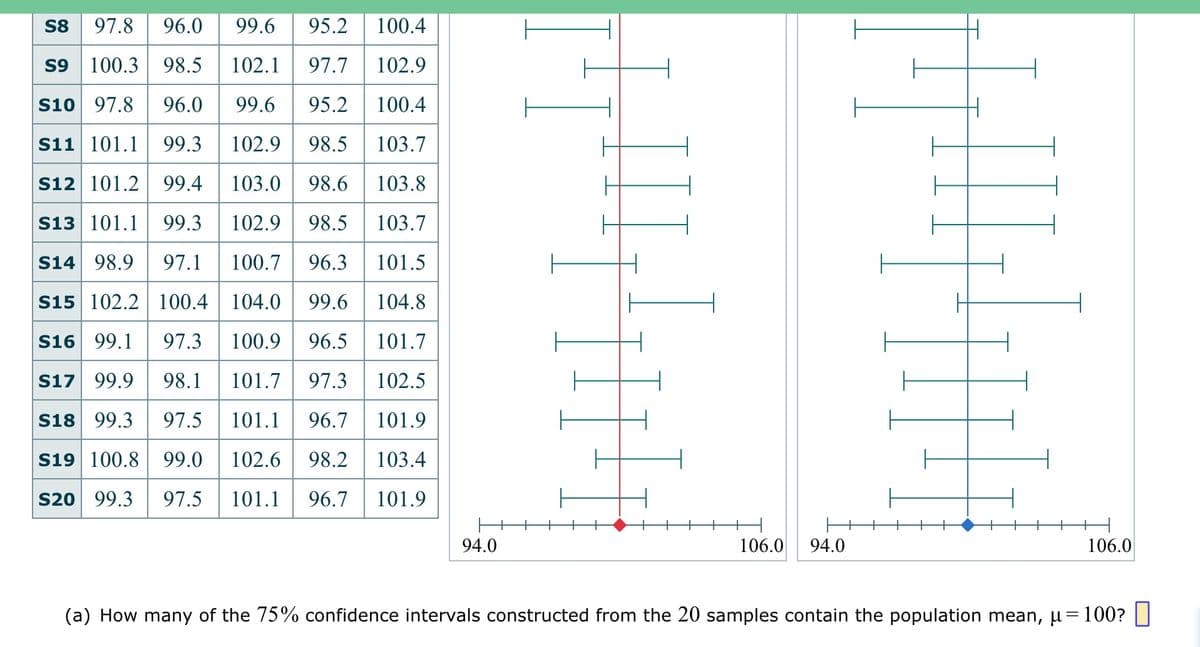
Transcribed Image Text:S8 97.8 96.0 99.6 95.2 100.4
S9 100.3 98.5 102.1 97.7
102.9
S10| 97.8 96.0 99.6 95.2
100.4
S11 101.1 99.3
102.9
98.5
103.7
S12 101.2 99.4 103.0 98.6 103.8
S13 101.1 99.3
102.9 98.5 103.7
S14 98.9 97.1 100.7 96.3
101.5
S15 102.2 | 100.4 | 104.0 99.6
104.8
S16 99.1 97.3 100.9 96.5 101.7
S17 99.9
98.1 101.7 97.3
102.5
S18 99.3 97.5 101.1
96.7
101.9
S19 100.8 99.0 102.6 98.2 103.4
S20 99.3 97.5 101.1 96.7 101.9
94.0
I-I
106.0 94.0
106.0
(a) How many of the 75% confidence intervals constructed from the 20 samples contain the population mean, µ =100? |
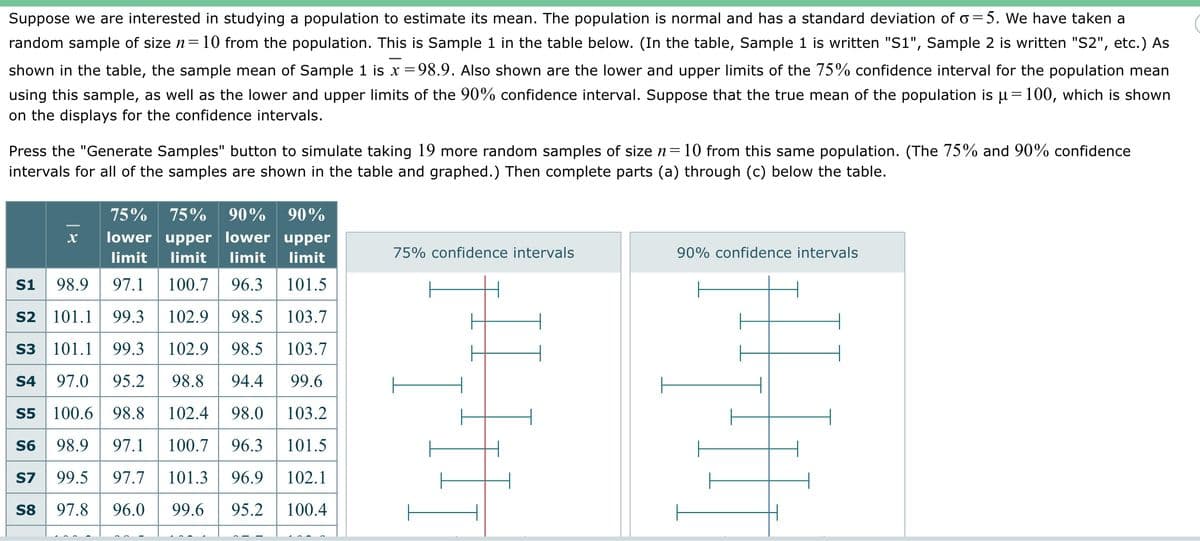
Transcribed Image Text:Suppose we are interested in studying a population to estimate its mean. The population is normal and has a standard deviation of a=5. We have taken a
random sample of size n = 10 from the population. This is Sample 1 in the table below. (In the table, Sample 1 is written "S1", Sample 2 is written "S2", etc.) As
shown in the table, the sample mean of Sample 1 is x =98.9. Also shown are the lower and upper limits of the 75% confidence interval for the population mean
using this sample, as well as the lower and upper limits of the 90% confidence interval. Suppose that the true mean of the population is µ = 100, which is shown
on the displays for the confidence intervals.
Press the "Generate Samples" button to simulate taking 19 more random samples of size n = 10 from this same population. (The 75% and 90% confidence
intervals for all of the samples are shown in the table and graphed.) Then complete parts (a) through (c) below the table.
75% 75% 90% 90%
lower upper lower upper
limit limit limit limit
S1 98.9
97.1 100.7 96.3
101.5
S2 101.1 99.3 102.9 98.5 103.7
S3 101.1 99.3 102.9 98.5 103.7
S4 97.0 95.2 98.8 94.4 99.6
S5 100.6 98.8
102.4 98.0 103.2
S6
98.9 97.1 100.7 96.3 101.5
S7 99.5 97.7
101.3 96.9
102.1
S8 97.8 96.0 99.6 95.2 100.4
X
75% confidence intervals
90% confidence intervals
Expert Solution
This question has been solved!
Explore an expertly crafted, step-by-step solution for a thorough understanding of key concepts.

Step by step
Solved in 3 steps with 15 images

Recommended textbooks for you
MATLAB: An Introduction with Applications
Statistics
ISBN:
9781119256830
Author:
Amos Gilat
Publisher:
John Wiley & Sons Inc

Probability and Statistics for Engineering and th…
Statistics
ISBN:
9781305251809
Author:
Jay L. Devore
Publisher:
Cengage Learning

Statistics for The Behavioral Sciences (MindTap C…
Statistics
ISBN:
9781305504912
Author:
Frederick J Gravetter, Larry B. Wallnau
Publisher:
Cengage Learning
MATLAB: An Introduction with Applications
Statistics
ISBN:
9781119256830
Author:
Amos Gilat
Publisher:
John Wiley & Sons Inc
Probability and Statistics for Engineering and th…
Statistics
ISBN:
9781305251809
Author:
Jay L. Devore
Publisher:
Cengage Learning
Statistics for The Behavioral Sciences (MindTap C…
Statistics
ISBN:
9781305504912
Author:
Frederick J Gravetter, Larry B. Wallnau
Publisher:
Cengage Learning

Elementary Statistics: Picturing the World (7th E…
Statistics
ISBN:
9780134683416
Author:
Ron Larson, Betsy Farber
Publisher:
PEARSON

The Basic Practice of Statistics
Statistics
ISBN:
9781319042578
Author:
David S. Moore, William I. Notz, Michael A. Fligner
Publisher:
W. H. Freeman

Introduction to the Practice of Statistics
Statistics
ISBN:
9781319013387
Author:
David S. Moore, George P. McCabe, Bruce A. Craig
Publisher:
W. H. Freeman