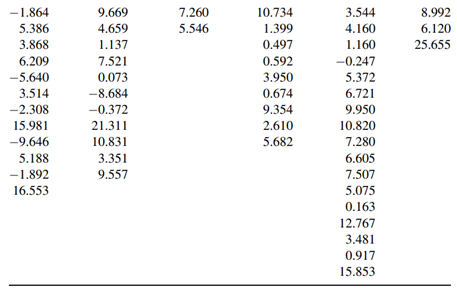
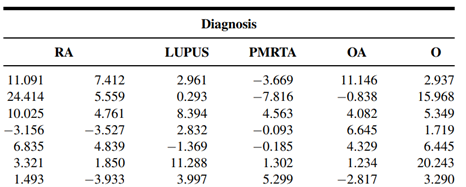
Patients suffering from rheumatic diseases or osteoporosis often suffer critical losses in bone mineral density (BMD). Alendronate is one medication prescribed to build or prevent further loss of BMD. Holcomb and Rothenberg (A-3) looked at 96 women taking alendronate to determine if a difference existed in the mean percent change in BMD among five different primary diagnosis classifications. Group 1 patients were diagnosed with rheumatoid arthritis (RA). Group 2 patients were a mixed collection of patients with diseases including lupus, Wegener’s granulomatosis and polyarteritis, and other vasculitic diseases (LUPUS). Group 3 patients had polymyalgia rheumatica or temporal arthritis (PMRTA). Group 4 patients had osteoarthritis (OA) and group 5 patients had osteoporosis (O) with no other rheumatic diseases identified in the medical record. Changes in BMD are shown in the following table. Discuss the Alendronate medication data in terms of variability. To determine if a difference existed in the mean percent change in BMD among five different primary diagnosis classifications. What does the comparison tell you about the variability of the observations?


Patients suffering from rheumatic diseases or osteoporosis often suffer critical losses in bone mineral density (BMD). Alendronate is one medication prescribed to build or prevent further loss of BMD. Holcomb and Rothenberg (A-3) looked at 96 women taking alendronate to determine if a difference existed in the mean percent change in BMD among five different primary diagnosis classifications. Group 1 patients were diagnosed with rheumatoid arthritis (RA). Group 2 patients were a mixed collection of patients with diseases including lupus, Wegener’s granulomatosis and polyarteritis, and other vasculitic diseases (LUPUS). Group 3 patients had polymyalgia rheumatica or temporal arthritis (PMRTA). Group 4 patients had osteoarthritis (OA) and group 5 patients had osteoporosis (O) with no other rheumatic diseases identified in the medical record. Changes in BMD are shown in the following table.
- Discuss the Alendronate medication data in terms of variability. To determine if a difference existed in the mean percent change in BMD among five different primary diagnosis classifications. What does the comparison tell you about the variability of the observations?
- State the null hypothesis in narrative form
- Compute for the statistical assumptions (normality and homogeneity ONLY). You can use the
descriptive statistics command in excel. - Compute for the test statistic. Use 0.05 level of significance.
- Compute for the critical value.
- Compute for the p value
- Compute for the confidence interval
- State the conclusion in narrative form.
Data is in the images.


Trending now
This is a popular solution!

Step by step
Solved in 3 steps


