PDUPIS aU Du Deviation, S, Of Sample otal number of sample values. Also, compare the computed standard deviation to the standard deviation obtained from the original list of data values, 9.0.
PDUPIS aU Du Deviation, S, Of Sample otal number of sample values. Also, compare the computed standard deviation to the standard deviation obtained from the original list of data values, 9.0.

MATLAB: An Introduction with Applications
6th Edition
ISBN:9781119256830
Author:Amos Gilat
Publisher:Amos Gilat
Chapter1: Starting With Matlab
Section: Chapter Questions
Problem 1P

Related questions

Question
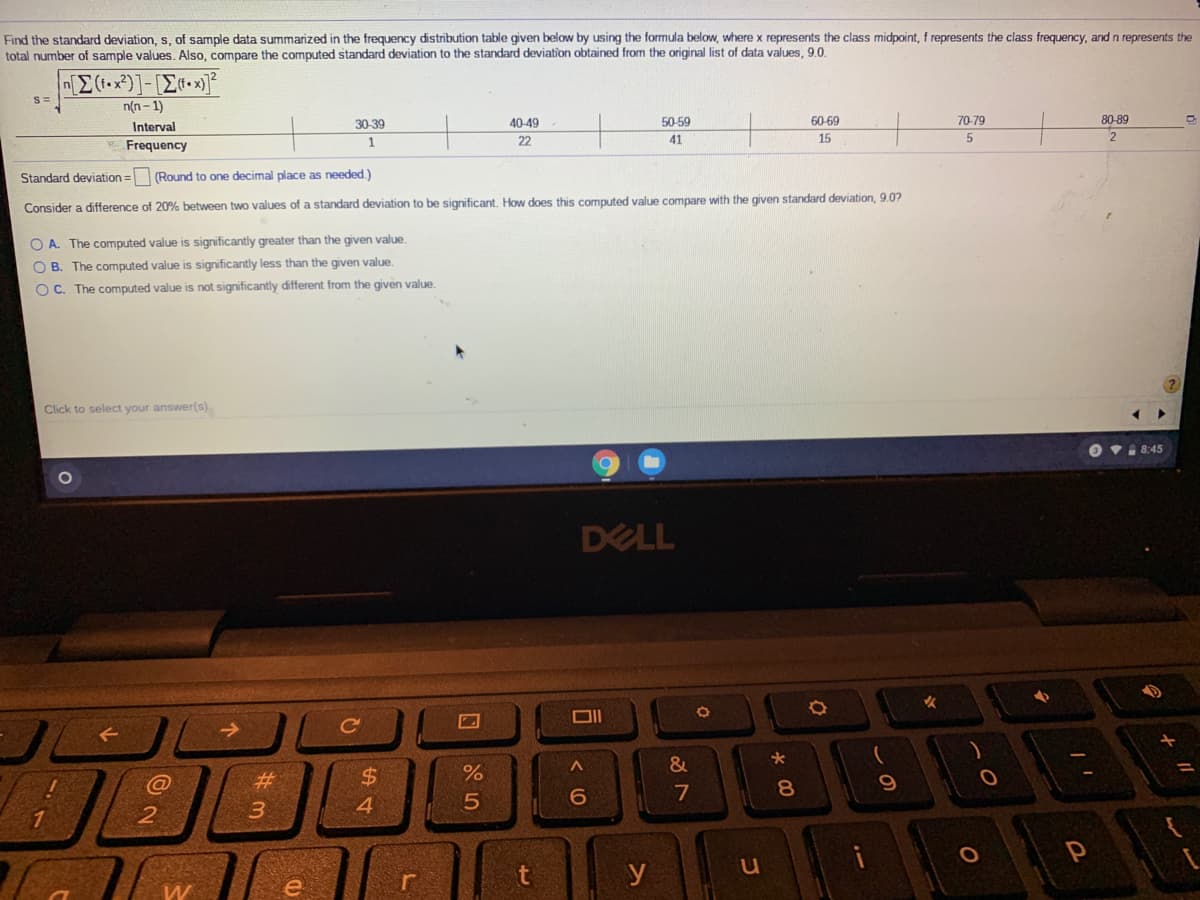
Transcribed Image Text:Find the standard deviation, s, of sample data summarized in the frequency distribution table given below by using the formula below, where x represents the class midpoint, f represents the class frequency, and n represents the
total number of sample values. Also, compare the computed standard deviation to the standard deviation obtained from the original list of data values, 9.0.
n(n - 1)
Interval
30-39
40-49
50-59
60-69
70-79
80-89
22
41
15
2
Frequency
1.
Standard deviation = (Round to one decimal place as needed.)
Consider a difference of 20% between two values of a standard deviation to be significant, How does this computed value compare with the given standard deviation, 9.0?
O A. The computed value is significantly greater than the given value.
O B. The computed value is significantly less than the given value.
OC. The computed value is not significantly different from the given value.
Click to select your answer(s).
O vi 8:45
DELL
%23
$
6
7
8.
4.
2
u
r
Expert Solution
Step 1
Given data is used to fit a standard deviation for the following data. the data is in inclusive so we need to covert into exclusive by adding 0.5 to the upper limit. and subtracting 0.5 to the lower limit.
Step 2
| class interval | friquencies(fi) | mid values (mi) | fi*mi | ||
| 29.5-39.5 | 1 | 34.5 | 34.5 | 463.9716 | 463.9716 |
|
39.5-49.5 |
22 | 44.5 | 979 | 133.1716 | 2929.7752 |
| 49.5-59.5 | 41 | 55.5 | 2275.5 | 0.1936 | 7.9376 |
| 59.5-69.5 | 15 | 65.5 | 982.5 | 89.4916 | 1342.374 |
| 69.5-79.5 | 5 | 75.5 | 377.5 | 378.6916 | 1893.458 |
| 79.5-89.5 | 2 | 85.5 | 171 | 867.8916 | 1735.7832 |
Total =86 =4820 =8373.2996
Step 3
Mean = =4820/86 = 56.04
Variance = =8373.2996/86 = 97.3639
standard deviation = =9.86

Step by step
Solved in 5 steps

Knowledge Booster


Learn more about
Need a deep-dive on the concept behind this application? Look no further. Learn more about this topic, statistics and related others by exploring similar questions and additional content below.Recommended textbooks for you
MATLAB: An Introduction with Applications
Statistics
ISBN:
9781119256830
Author:
Amos Gilat
Publisher:
John Wiley & Sons Inc

Probability and Statistics for Engineering and th…
Statistics
ISBN:
9781305251809
Author:
Jay L. Devore
Publisher:
Cengage Learning

Statistics for The Behavioral Sciences (MindTap C…
Statistics
ISBN:
9781305504912
Author:
Frederick J Gravetter, Larry B. Wallnau
Publisher:
Cengage Learning
MATLAB: An Introduction with Applications
Statistics
ISBN:
9781119256830
Author:
Amos Gilat
Publisher:
John Wiley & Sons Inc
Probability and Statistics for Engineering and th…
Statistics
ISBN:
9781305251809
Author:
Jay L. Devore
Publisher:
Cengage Learning
Statistics for The Behavioral Sciences (MindTap C…
Statistics
ISBN:
9781305504912
Author:
Frederick J Gravetter, Larry B. Wallnau
Publisher:
Cengage Learning

Elementary Statistics: Picturing the World (7th E…
Statistics
ISBN:
9780134683416
Author:
Ron Larson, Betsy Farber
Publisher:
PEARSON

The Basic Practice of Statistics
Statistics
ISBN:
9781319042578
Author:
David S. Moore, William I. Notz, Michael A. Fligner
Publisher:
W. H. Freeman

Introduction to the Practice of Statistics
Statistics
ISBN:
9781319013387
Author:
David S. Moore, George P. McCabe, Bruce A. Craig
Publisher:
W. H. Freeman