pelow is an output of Pearson co etween height and shoe size and wh Correlations age age Pearson Correlation Sig. (2-tailed) 1
pelow is an output of Pearson co etween height and shoe size and wh Correlations age age Pearson Correlation Sig. (2-tailed) 1

Glencoe Algebra 1, Student Edition, 9780079039897, 0079039898, 2018
18th Edition
ISBN:9780079039897
Author:Carter
Publisher:Carter
Chapter4: Equations Of Linear Functions
Section4.5: Correlation And Causation
Problem 2CYU

Related questions
Topic Video
Question
100%
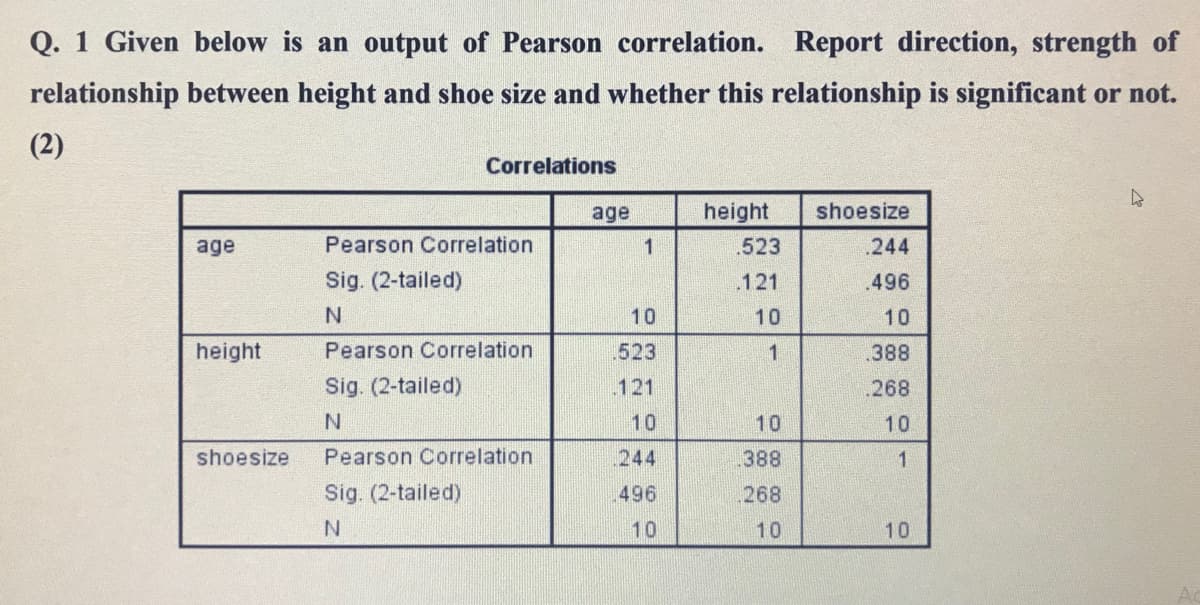
Transcribed Image Text:Q. 1 Given below is an output of Pearson correlation. Report direction, strength of
relationship between height and shoe size and whether this relationship is significant or not.
(2)
Correlations
age
height
shoesize
age
Pearson Correlation
523
.244
Sig. (2-tailed)
.121
.496
10
10
10
height
Pearson Correlation
523
1
388
Sig. (2-tailed)
121
.268
N.
10
10
10
shoesize
Pearson Correlation
244
388
Sig. (2-tailed)
496
268
10
10
10
Expert Solution
This question has been solved!
Explore an expertly crafted, step-by-step solution for a thorough understanding of key concepts.

Step by step
Solved in 2 steps with 1 images

Knowledge Booster


Learn more about
Need a deep-dive on the concept behind this application? Look no further. Learn more about this topic, statistics and related others by exploring similar questions and additional content below.Recommended textbooks for you
Glencoe Algebra 1, Student Edition, 9780079039897…
Algebra
ISBN:
9780079039897
Author:
Carter
Publisher:
McGraw Hill
Glencoe Algebra 1, Student Edition, 9780079039897…
Algebra
ISBN:
9780079039897
Author:
Carter
Publisher:
McGraw Hill