Per the following graph, explain the reason for every statistic that is calculated. For example, You have a scatter plot of an hourly wages vs level of education, the trend is represented by a cubic curve with R^2=0.999. It can mean that the relationship of the level of education vs the hourly wages has a cubic trend as the cubic model sui
Per the following graph, explain the reason for every statistic that is calculated. For example, You have a scatter plot of an hourly wages vs level of education, the trend is represented by a cubic curve with R^2=0.999. It can mean that the relationship of the level of education vs the hourly wages has a cubic trend as the cubic model sui

Linear Algebra: A Modern Introduction
4th Edition
ISBN:9781285463247
Author:David Poole
Publisher:David Poole
Chapter2: Systems Of Linear Equations
Section2.4: Applications
Problem 15EQ

Related questions
Question
Data Management - Statistical Anaylsis
Per the following graph, explain the reason for every statistic that is calculated.
For example, You have a
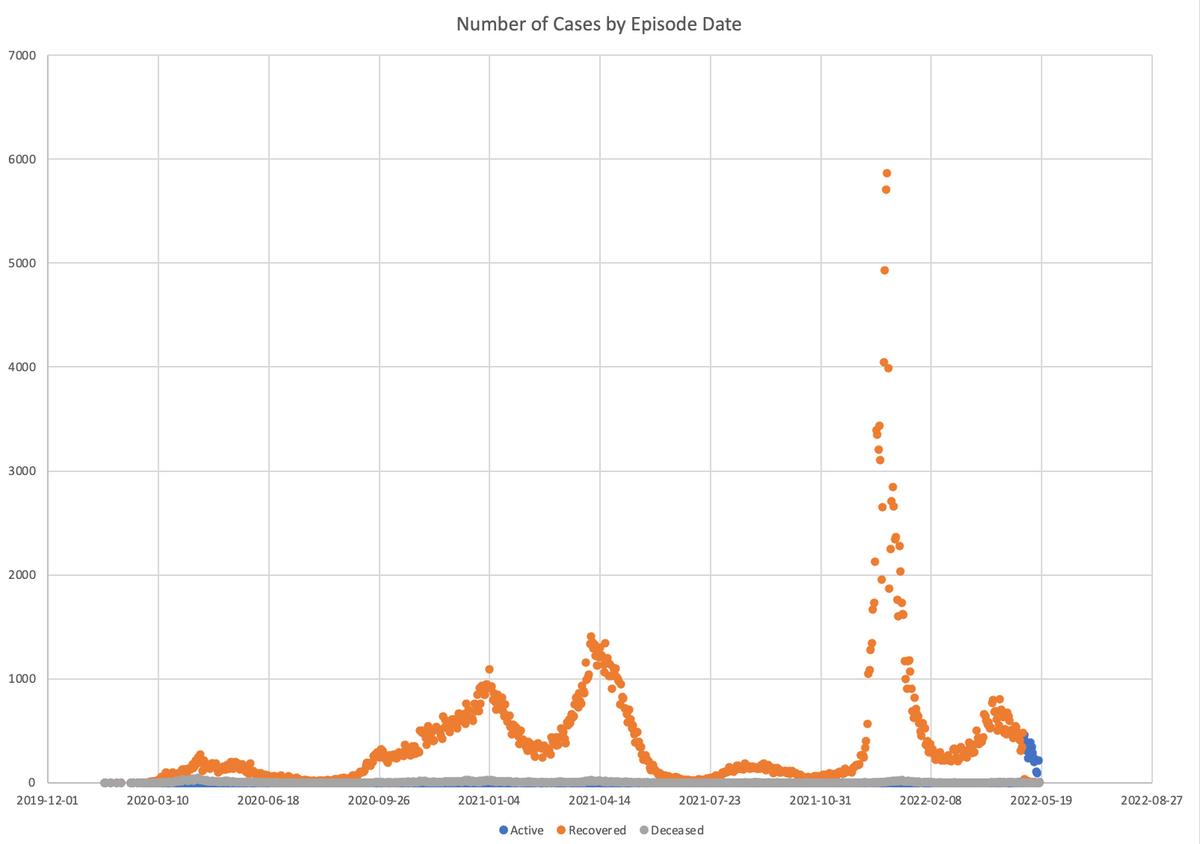
Transcribed Image Text:7000
6000
5000
4000
3000
2000
1000
0
2019-12-01
2020-03-10
2020-06-18
2020-09-26
Number of Cases by Episode Date
2021-01-04
2021-04-14
● Active ● Recovered ●Deceased
2021-07-23
2021-10-31
:
2022-02-08
2022-05-19
2022-08-27
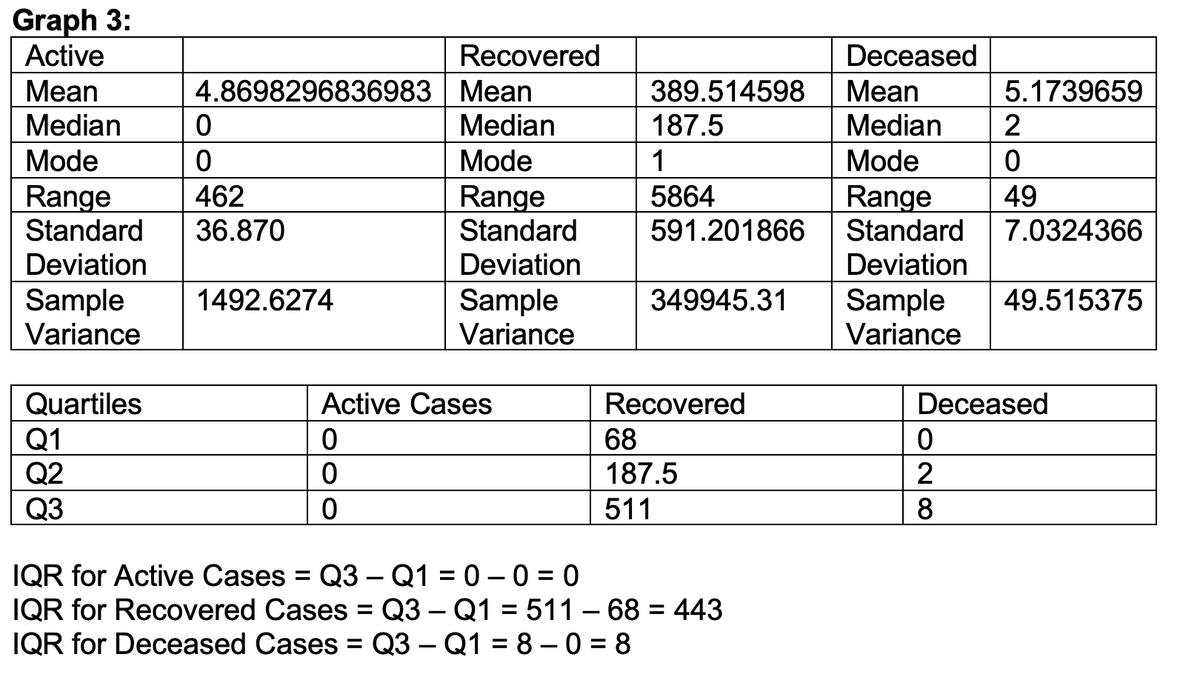
Transcribed Image Text:Graph 3:
Active
Mean
4.8698296836983
Median
0
Mode
0
Range
462
Standard 36.870
Deviation
Sample
Variance
Quartiles
Active Cases
Recovered
Q1
0
68
Q2
0
187.5
Q3
0
511
IQR for Active Cases = Q3 - Q1 = 0 -0 =0
IQR for Recovered Cases = Q3 - Q1 = 511 - 68 = 443
IQR for Deceased Cases = Q3 - Q1 =8-0=8
1492.6274
Recovered
Mean
Median
Mode
Range
Standard
Deviation
Sample
Variance
389.514598
187.5
1
5864
591.201866
349945.31
Deceased
Mean
Median
Mode
Range
Standard
Deviation
Sample
Variance
Deceased
0
2
28
5.1739659
2
0
49
7.0324366
49.515375
8
Expert Solution
This question has been solved!
Explore an expertly crafted, step-by-step solution for a thorough understanding of key concepts.

Step by step
Solved in 2 steps

Recommended textbooks for you
Linear Algebra: A Modern Introduction
Algebra
ISBN:
9781285463247
Author:
David Poole
Publisher:
Cengage Learning

Algebra & Trigonometry with Analytic Geometry
Algebra
ISBN:
9781133382119
Author:
Swokowski
Publisher:
Cengage
Linear Algebra: A Modern Introduction
Algebra
ISBN:
9781285463247
Author:
David Poole
Publisher:
Cengage Learning
Algebra & Trigonometry with Analytic Geometry
Algebra
ISBN:
9781133382119
Author:
Swokowski
Publisher:
Cengage