Root_lenght Treatment Root_lenght Treatmen t control 3dS 6dS 9dS 12dS Total Case Processing Summary Cases Included Excluded Total Percent N Percent N Percent N 300 99.7% 1 0.3% 301 100.0% Case Summaries Minimu Std. Deviation m N Mean Median 60 4.6750 4.8000 60 6.9783 6.3500 60 5.3633 5.3000 60 2.3500 2.1000 60 2.3538 2.2500 300 4.3441 3.8000 20.00- 15.00- 10.00- 5.00 20.00- 15.00- Root_lenght 10.00- 5.00 control 315 1.40 2.60 .90 .70 90 .70 Maximu m 10.10 17.00 10.00 5.10 4.30 17.00 147 43 46 47 poe 605 Treatment % HH 905 Kurtosis 1.66821 .721 3.06882 1.264 2.48684 -.938- .90113 .445 .76640 -.456- 2.66827 2.374 H
Root_lenght Treatment Root_lenght Treatmen t control 3dS 6dS 9dS 12dS Total Case Processing Summary Cases Included Excluded Total Percent N Percent N Percent N 300 99.7% 1 0.3% 301 100.0% Case Summaries Minimu Std. Deviation m N Mean Median 60 4.6750 4.8000 60 6.9783 6.3500 60 5.3633 5.3000 60 2.3500 2.1000 60 2.3538 2.2500 300 4.3441 3.8000 20.00- 15.00- 10.00- 5.00 20.00- 15.00- Root_lenght 10.00- 5.00 control 315 1.40 2.60 .90 .70 90 .70 Maximu m 10.10 17.00 10.00 5.10 4.30 17.00 147 43 46 47 poe 605 Treatment % HH 905 Kurtosis 1.66821 .721 3.06882 1.264 2.48684 -.938- .90113 .445 .76640 -.456- 2.66827 2.374 H

Glencoe Algebra 1, Student Edition, 9780079039897, 0079039898, 2018
18th Edition
ISBN:9780079039897
Author:Carter
Publisher:Carter
Chapter10: Statistics
Section10.4: Distributions Of Data
Problem 8PPS

Related questions
Question
I want to explain these results
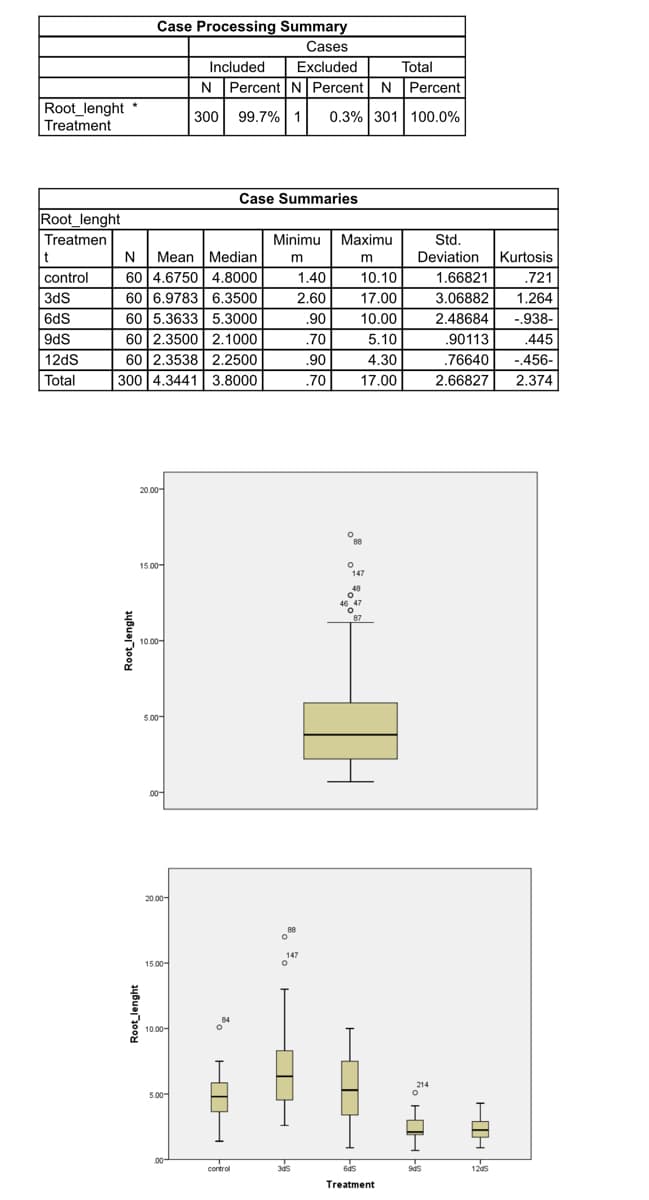
Transcribed Image Text:Root_lenght *
Treatment
Root_lenght
Treatmen
t
control
3dS
6dS
9dS
12dS
Total
Root_lenght
Case Processing Summary
Cases
Included
Excluded
Total
Percent N Percent N Percent
99.7% 1
0.3% 301 100.0%
Case Summaries
Std.
Deviation
N Mean Median
60 4.6750 4.8000
6.3500
60 6.9783
60 5.3633 5.3000
60 2.3500
2.1000
60 2.3538
2.2500
300 4.3441 3.8000
20.00-
15.00-
Root_lenght
10.00-
5.00-
00-
20.00-
15.00-
N
300
10.00-
5.00-
84
O
control
Minimu Maximu
m
m
1.40
10.10
2.60
17.00
.90
10.00
.70
5.10
.90
4.30
.70
17.00
OOR
88
u
147
48
ofe
147
O
3ds
47
87
O
6d5
Treatment
214
HH
945
1.66821
3.06882
2.48684
.90113
.76640
2.66827
H
1245
Kurtosis
.721
1.264
-.938-
.445
-.456-
2.374
Expert Solution
This question has been solved!
Explore an expertly crafted, step-by-step solution for a thorough understanding of key concepts.

Step by step
Solved in 2 steps

Recommended textbooks for you
Glencoe Algebra 1, Student Edition, 9780079039897…
Algebra
ISBN:
9780079039897
Author:
Carter
Publisher:
McGraw Hill
Glencoe Algebra 1, Student Edition, 9780079039897…
Algebra
ISBN:
9780079039897
Author:
Carter
Publisher:
McGraw Hill