perform a two-sample t-test analysis to determine if mean absenteeism is different between organizations which have a good Union management and those that do not. Can you please explain the steps to get this in excel?
perform a two-sample t-test analysis to determine if mean absenteeism is different between organizations which have a good Union management and those that do not. Can you please explain the steps to get this in excel?

Algebra & Trigonometry with Analytic Geometry
13th Edition
ISBN:9781133382119
Author:Swokowski
Publisher:Swokowski
Chapter7: Analytic Trigonometry
Section7.6: The Inverse Trigonometric Functions
Problem 93E

Related questions
Topic Video
Question
Two-sample t-test
I need to perform a two-sample t-test analysis to determine if mean absenteeism is different between organizations which have a good Union management and those that do not. Can you please explain the steps to get this in excel?
Data:
| Wage | Pct PT | Pct U | Av Shift | U/M Rel | Absent |
| 22477 | 8.5 | 57.1 | 1 | 1 | 5.4 |
| 29939 | 1.9 | 41.5 | 0 | 1 | 4.1 |
| 22957 | 12.2 | 52.6 | 1 | 0 | 11.5 |
| 18888 | 30.8 | 65.1 | 0 | 1 | 2.1 |
| 15078 | 6.8 | 68.8 | 0 | 1 | 5.9 |
| 15481 | 5.1 | 46.4 | 0 | 0 | 12.9 |
| 21481 | 25.3 | 38.9 | 0 | 1 | 3.5 |
| 29687 | 9.2 | 17.2 | 0 | 0 | 2.6 |
| 13603 | 8.4 | 12.9 | 0 | 0 | 8.6 |
| 18303 | 4.9 | 18.1 | 0 | 1 | 2.7 |
| 20832 | 23.8 | 64.4 | 1 | 1 | 6.6 |
| 22325 | 24.1 | 63.7 | 1 | 1 | 2.1 |
| 19964 | 8.6 | 12.2 | 0 | 1 | 3.8 |
| 32496 | 5.9 | 11.8 | 1 | 0 | 4.3 |
| 15795 | 2.9 | 25.8 | 0 | 1 | 4.3 |
| 21138 | 24.3 | 53.2 | 0 | 0 | 2.2 |
| 18859 | 20.6 | 22.8 | 1 | 1 | 8.6 |
| 12023 | 9 | 49.8 | 1 | 1 | 10.8 |
| 33272 | 24 | 39.1 | 1 | 0 | 2.9 |
| 22325 | 11.9 | 32.6 | 1 | 0 | 5.3 |
| 26147 | 0 | 67.7 | 1 | 0 | 8.2 |
| 33229 | 11.7 | 10.8 | 0 | 0 | 2.8 |
| 37970 | 14.6 | 25.5 | 1 | 1 | 2.4 |
| 15281 | 27.2 | 31.8 | 0 | 0 | 2.8 |
| 19423 | 17.2 | 35 | 1 | 1 | 5 |
| 26587 | 13.9 | 41.9 | 1 | 1 | 9.5 |
| 22963 | 2.6 | 52.9 | 0 | 1 | 4.3 |
| 26404 | 6.4 | 64.4 | 0 | 1 | 8.9 |
| 16315 | 4.9 | 69.7 | 0 | 1 | 7.2 |
| 26759 | 23.2 | 61.8 | 1 | 1 | 5.6 |
| 30824 | 13.2 | 52.1 | 0 | 1 | 2.4 |
| 31979 | 27.7 | 57.4 | 1 | 1 | 2.7 |
| 23135 | 7 | 15.2 | 0 | 0 | 13.4 |
| 18014 | 0 | 38.7 | 1 | 0 | 14.8 |
| 18541 | 13.8 | 69.4 | 1 | 1 | 10.7 |
| 16747 | 9.9 | 67.2 | 1 | 0 | 10.3 |
| 13473 | 6.3 | 47.8 | 0 | 1 | 4.6 |
| 42986 | 13.4 | 24.5 | 1 | 0 | 3.9 |
| 23964 | 8.8 | 79.4 | 1 | 0 | 13.3 |
| 30794 | 0.4 | 12.1 | 1 | 0 | 2.2 |
| 21104 | 14.7 | 71 | 0 | 1 | 5.7 |
| 19137 | 7.7 | 28 | 1 | 0 | 11.8 |
| 26058 | 7.3 | 45.6 | 0 | 1 | 2.5 |
| 22085 | 6.8 | 25.4 | 0 | 1 | 2.1 |
| 29044 | 8.6 | 40.6 | 0 | 0 | 4.1 |
| 24205 | 19.6 | 25.1 | 1 | 1 | 4.9 |
| 17698 | 10.8 | 42.3 | 1 | 1 | 7.7 |
| 26399 | 4.5 | 63.3 | 1 | 1 | 6.3 |
| 40590 | 15.9 | 69.4 | 1 | 1 | 2.9 |
| 24805 | 5.7 | 17.7 | 1 | 1 | 2.6 |
| 18899 | 13.1 | 54.8 | 1 | 1 | 6.1 |
| 26802 | 15.5 | 46.5 | 0 | 1 | 6 |
| 30034 | 11.8 | 53.2 | 1 | 0 | 6.7 |
| 15713 | 16.6 | 41.2 | 1 | 0 | 11.9 |
| 18280 | 6.4 | 65 | 1 | 1 | 9.3 |
| 41009 | 6.7 | 54.9 | 0 | 1 | 3.6 |
| 24021 | 14 | 20.6 | 1 | 1 | 2.6 |
| 21836 | 27.6 | 29 | 0 | 1 | 2.1 |
| 21157 | 5.5 | 50.2 | 1 | 1 | 9 |
| 19529 | 14.5 | 56.6 | 1 | 0 | 11 |
| 31240 | 26.3 | 36.4 | 1 | 1 | 2.9 |
| 20963 | 0 | 0 | 1 | 1 | 2.2 |
| 33826 | 8.2 | 87.9 | 0 | 1 | 3.3 |
| 23349 | 0 | 38.5 | 1 | 1 | 5.9 |
| 22695 | 25.4 | 47 | 1 | 1 | 4 |
| 30475 | 0 | 69.3 | 1 | 0 | 10.8 |
| 16631 | 5.9 | 48.2 | 1 | 1 | 7.1 |
| 28996 | 18.6 | 29.3 | 1 | 1 | 2.9 |
| 15807 | 16.9 | 42.9 | 1 | 1 | 6.2 |
| 15585 | 0 | 59.4 | 1 | 0 | 10.3 |
| 18466 | 9 | 69.4 | 1 | 0 | 13.5 |
| 35140 | 21.1 | 37.1 | 1 | 1 | 6.7 |
| 33459 | 14.1 | 19.5 | 1 | 1 | 2.6 |
| 24357 | 0 | 21.5 | 1 | 1 | 5.2 |
| 19370 | 3.7 | 35 | 1 | 1 | 7.2 |
| 21820 | 6.3 | 0 | 1 | 1 | 3.5 |
| 23351 | 12.3 | 27.1 | 1 | 1 | 5.4 |
| 22938 | 6.8 | 68.5 | 1 | 1 | 5.8 |
| 16477 | 10 | 61.5 | 1 | 1 | 11.7 |
| 20790 | 28.5 | 59.9 | 1 | 0 | 5.6 |
| 20352 | 19.4 | 34.6 | 1 | 0 | 4.6 |
| 19743 | 14.3 | 39.7 | 1 | 0 | 8.6 |
| 22775 | 10.3 | 35.7 | 1 | 1 | 2.1 |
| 24229 | 0.9 | 26.7 | 1 | 0 | 9.6 |
| 41195 | 8.6 | 66.7 | 1 | 0 | 4 |
| 23143 | 4.2 | 63.1 | 0 | 1 | 10.6 |
| 13400 | 28.1 | 46.7 | 0 | 0 | 5.8 |
| 21371 | 14.9 | 78.9 | 1 | 0 | 7.4 |
| 28675 | 7.7 | 63.4 | 0 | 0 | 10.3 |
| 18171 | 6.9 | 47.9 | 0 | 1 | 6.3 |
| 23670 | 20.5 | 46.3 | 1 | 1 | 6.7 |
| 29745 | 6.1 | 53.9 | 1 | 0 | 6.7 |
| 14672 | 13.9 | 46 | 1 | 0 | 13.3 |
| 20382 | 0 | 38.6 | 1 | 1 | 4.1 |
| 24952 | 14.6 | 53.8 | 0 | 1 | 4.6 |
| 28878 | 7.4 | 12.2 | 1 | 1 | 2.7 |
| 24558 | 24.5 | 37 | 1 | 1 | 8 |
| 20447 | 0.9 | 27.4 | 1 | 1 | 4.2 |
| 27714 | 8.7 | 58.1 | 0 | 0 | 9 |
| 18116 | 3.5 | 47.5 | 1 | 1 | 7.7 |
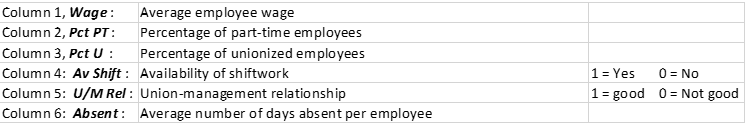
Transcribed Image Text:Column 1, Wage:
Average employee wage
Column 2, Pct PT:
Percentage of part-time employees
Column 3, Pct U :
Percentage of unionized employees
Column 4: Av Shift : Availability of shiftwork
1= Yes
0 = No
Column 5: U/M Rel : Union-management relationship
1= good 0 = Not good
Column 6: Absent: Average number of days absent per employee
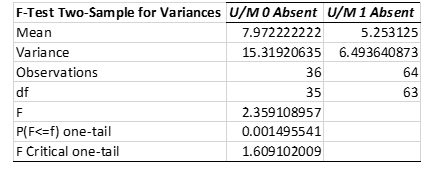
Transcribed Image Text:F-Test Two-Sample for Variances U/MO Absent U/M1 Absent
Mean
7.972222222
5.253125
Variance
15.31920635 6.493640873
Observations
36
64
df
35
63
F
2.359108957
P(F<=f) one-tail
0.001495541
F Critical one-tail
1.609102009
Expert Solution
This question has been solved!
Explore an expertly crafted, step-by-step solution for a thorough understanding of key concepts.

This is a popular solution!

Trending now
This is a popular solution!

Step by step
Solved in 4 steps with 1 images

Knowledge Booster


Learn more about
Need a deep-dive on the concept behind this application? Look no further. Learn more about this topic, statistics and related others by exploring similar questions and additional content below.Recommended textbooks for you
Algebra & Trigonometry with Analytic Geometry
Algebra
ISBN:
9781133382119
Author:
Swokowski
Publisher:
Cengage

Glencoe Algebra 1, Student Edition, 9780079039897…
Algebra
ISBN:
9780079039897
Author:
Carter
Publisher:
McGraw Hill

Algebra & Trigonometry with Analytic Geometry
Algebra
ISBN:
9781133382119
Author:
Swokowski
Publisher:
Cengage
Glencoe Algebra 1, Student Edition, 9780079039897…
Algebra
ISBN:
9780079039897
Author:
Carter
Publisher:
McGraw Hill

Mathematics For Machine Technology
Advanced Math
ISBN:
9781337798310
Author:
Peterson, John.
Publisher:
Cengage Learning,