Phosphorous is a chemical that is found in many household cleaning products. Unfortunately, phosphorous also finds its way into surface water, where it can harm fish, plants, and other wildlife. Two methods of phosphorous reduction are being studied. At a random sample of 7 locations, both methods were used and the total phosphorous reduction (mg/L) was recorded. Note: For degrees of freedom d.f. not in the Student's t table, use the closest d.f. that is smaller. In some situations, this choice of d.f. may increase the P-value a small amount and thereby produce a slightly more "conservative" answer. Things that are labelled i underneath a b c, etc are all part of that part.
Phosphorous is a chemical that is found in many household cleaning products. Unfortunately, phosphorous also finds its way into surface water, where it can harm fish, plants, and other wildlife. Two methods of phosphorous reduction are being studied. At a random sample of 7 locations, both methods were used and the total phosphorous reduction (mg/L) was recorded. Note: For degrees of freedom d.f. not in the Student's t table, use the closest d.f. that is smaller. In some situations, this choice of d.f. may increase the P-value a small amount and thereby produce a slightly more "conservative" answer. Things that are labelled i underneath a b c, etc are all part of that part.

Holt Mcdougal Larson Pre-algebra: Student Edition 2012
1st Edition
ISBN:9780547587776
Author:HOLT MCDOUGAL
Publisher:HOLT MCDOUGAL
Chapter11: Data Analysis And Probability
Section: Chapter Questions
Problem 8CR

Related questions
Topic Video
Question
Phosphorous is a chemical that is found in many household cleaning products. Unfortunately, phosphorous also finds its way into surface water, where it can harm fish, plants, and other wildlife. Two methods of phosphorous reduction are being studied. At a random sample of 7 locations, both methods were used and the total phosphorous reduction (mg/L) was recorded. Note: For degrees of freedom d.f. not in the Student's t table, use the closest d.f. that is smaller. In some situations, this choice of d.f. may increase the P-value a small amount and thereby produce a slightly more "conservative" answer.
Things that are labelled i underneath a b c, etc are all part of that part.
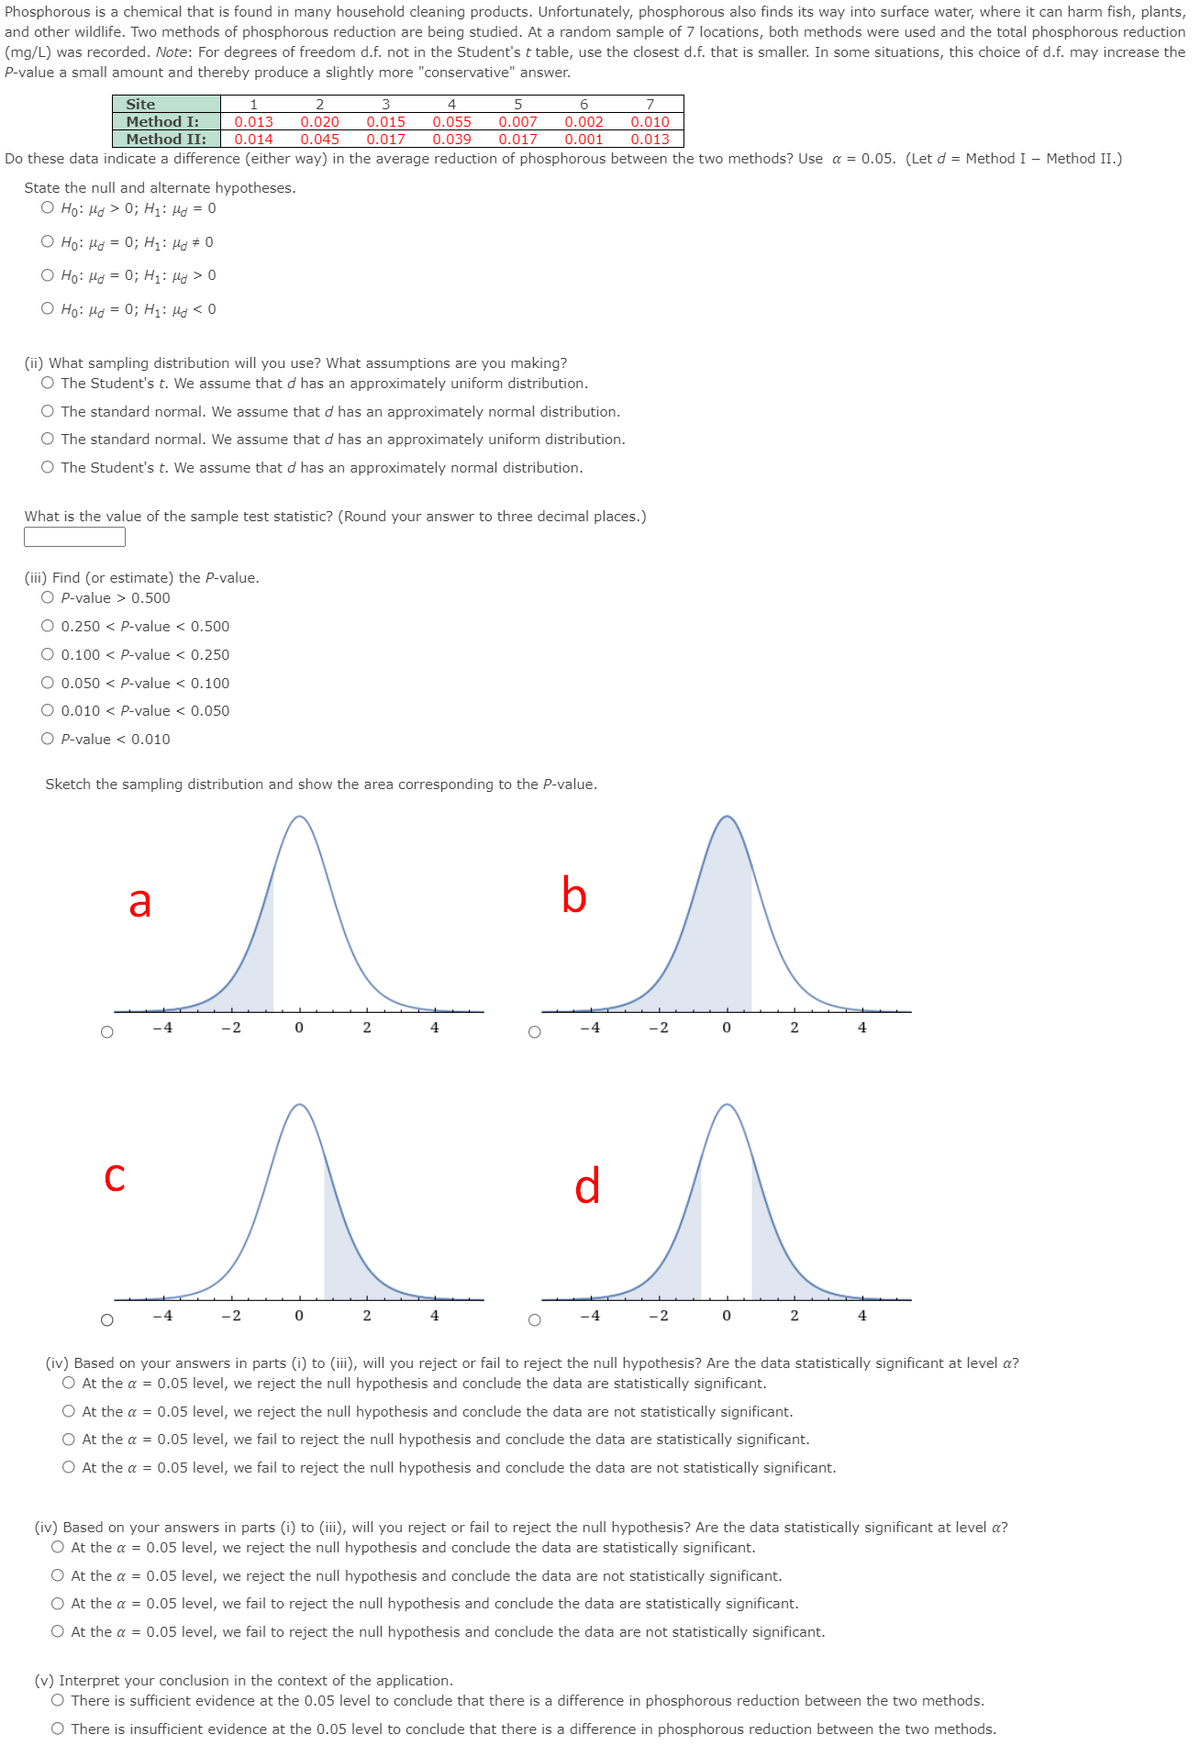
Transcribed Image Text:Phosphorous is a chemical that is found in many household cleaning products. Unfortunately, phosphorous also finds its way into surface water, where it can harm fish, plants,
and other wildlife. Two methods of phosphorous reduction are being studied. At a random sample of 7 locations, both methods were used and the total phosphorous reduction
(mg/L) was recorded. Note: For degrees of freedom d.f. not in the Student's t table, use the closest d.f. that is smaller. In some situations, this choice of d.f. may increase the
P-value a small amount and thereby produce a slightly more "conservative" answer.
Site
Method I:
1
2
3
4
6
7
0.055
0.039
0.013
0.015
0.007
0.017
0.020
0.002
0.010
Method II:
0.014
0.045
0.017
0.001
0.013
Do these data indicate a difference (either way) in the average reduction of phosphorous between the two methods? Use a = 0.05. (Let d = Method I – Method II.)
State the null and alternate hypotheses.
O Ho: Hd> 0; H1: Hd = 0
O Ho: Hd = 0; H1: Hd# 0
O Ho: Hd = 0; H1: Hd> 0
O Ho: Hd = 0; H1: Hd < 0
(ii) What sampling distribution will you use? What assumptions are you making?
O The Student's t. We assume that d has an approximately uniform distribution.
O The standard normal. We assume that d has an approximately normal distribution.
O The standard normal. We assume that d has an approximately uniform distribution.
O The Student's t. We assume that d has an approximately normal distribution.
What is the value of the sample test statistic? (Round your answer to three decimal places.)
(iii) Find (or estimate) the P-value.
O P-value > 0.500
O 0.250 < P-value < 0.500
O 0.100 < P-value < 0.250
O 0.050 < P-value < 0.100
O 0.010 < P-value < 0.050
O P-value < 0.010
Sketch the sampling distribution and show the area corresponding to the P-value.
a
b
2.
4
-2
2
4.
C
d
2
4
-4
-2
2
4
(iv) Based on your answers in parts (i) to (iii), will you reject or fail to reject the null hypothesis? Are the data statistically significant at level a?
O At the a = 0.05 level, we reject the null hypothesis and conclude the data are statistically significant.
O At the a = 0.05 level, we reject the null hypothesis and conclude the data are not statistically significant.
O At the a = 0.05 level, we fail to reject the null hypothesis and conclude the data are statistically significant.
O At the a = 0.05 level, we fail to reject the null hypothesis and conclude the data are not statistically significant.
(v) Interpret your conclusion in the context of the application.
O There is sufficient evidence at the 0.05 level to conclude that there is a difference in phosphorous reduction between the two methods.
O There is insufficient evidence at the 0.05 level to conclude that there is a difference in phosphorous reduction between the two methods.
Expert Solution
This question has been solved!
Explore an expertly crafted, step-by-step solution for a thorough understanding of key concepts.

This is a popular solution!

Trending now
This is a popular solution!

Step by step
Solved in 5 steps

Knowledge Booster


Learn more about
Need a deep-dive on the concept behind this application? Look no further. Learn more about this topic, statistics and related others by exploring similar questions and additional content below.Recommended textbooks for you
Holt Mcdougal Larson Pre-algebra: Student Edition…
Algebra
ISBN:
9780547587776
Author:
HOLT MCDOUGAL
Publisher:
HOLT MCDOUGAL

Glencoe Algebra 1, Student Edition, 9780079039897…
Algebra
ISBN:
9780079039897
Author:
Carter
Publisher:
McGraw Hill
Holt Mcdougal Larson Pre-algebra: Student Edition…
Algebra
ISBN:
9780547587776
Author:
HOLT MCDOUGAL
Publisher:
HOLT MCDOUGAL
Glencoe Algebra 1, Student Edition, 9780079039897…
Algebra
ISBN:
9780079039897
Author:
Carter
Publisher:
McGraw Hill