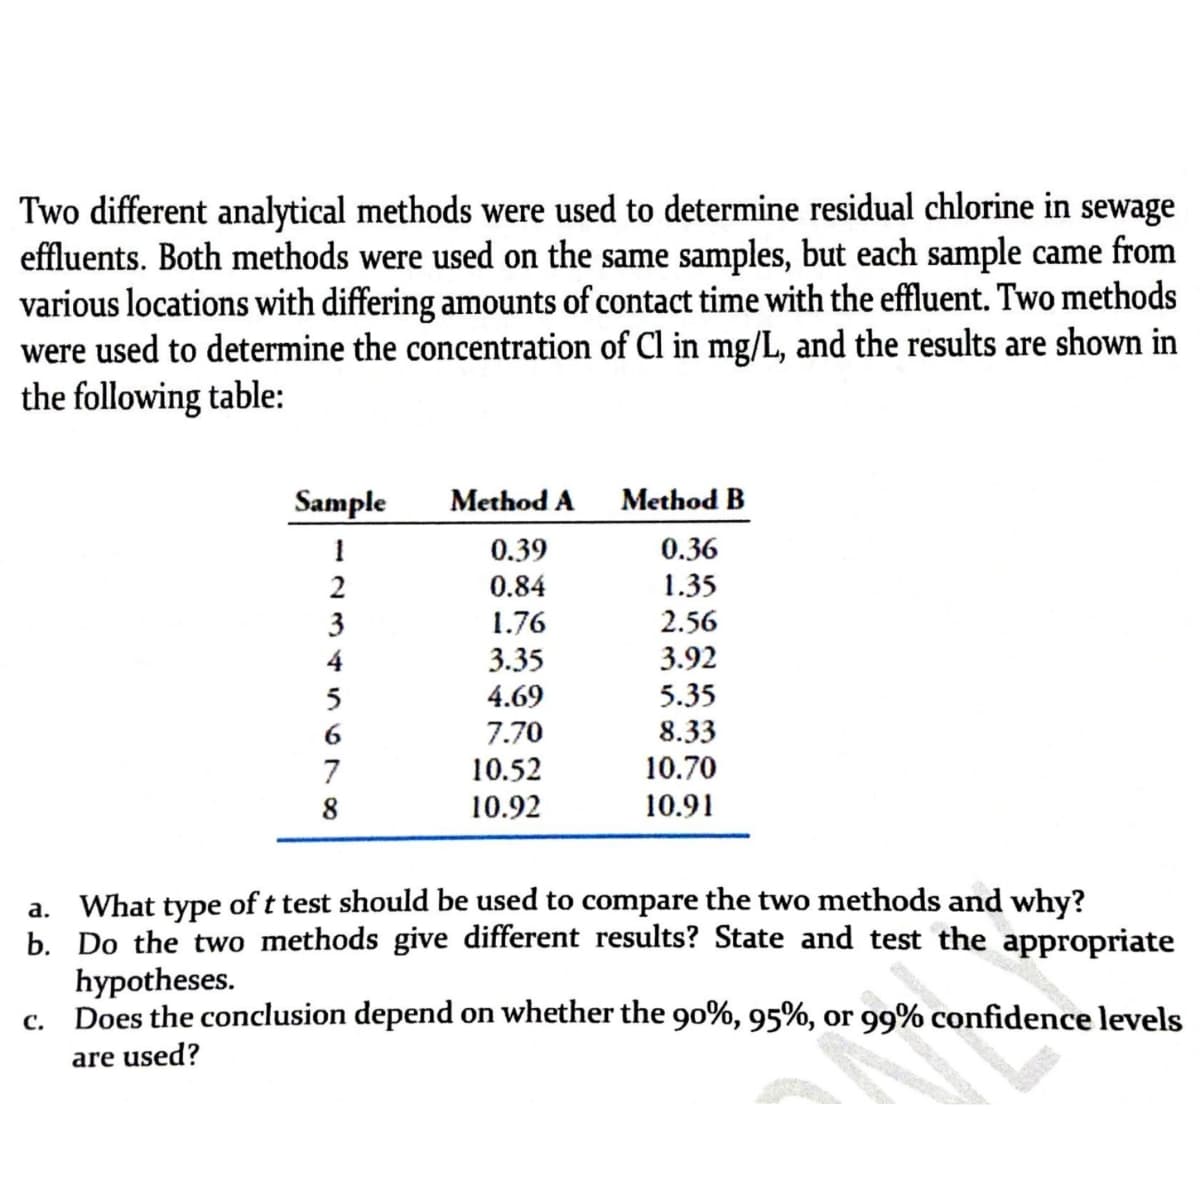
Two different analytical methods were used to determine residual chlorine in sewage effluents. Both methods were used on the same samples, but each sample came from various locations with differing amounts of contact time with the effluent. Two methods were used to determine the concentration of Cl in mg/L, and the results are shown in the following table: Sample Method A Method B 0.36 1.35 0.39 2 0.84 3 1.76 2.56 3.92 3.35 4.69 4 5.35 8.33 10.70 5 6. 7.70 7 10.52 8 10.92 10.91 a. What type of t test should be used to compare the two methods and why? b. Do the two methods give different results? State and test the appropriate hypotheses. c. Does the conclusion depend on whether the 90%, 95%, or 99% confidence levels are used?
Two different analytical methods were used to determine residual chlorine in sewage effluents. Both methods were used on the same samples, but each sample came from various locations with differing amounts of contact time with the effluent. Two methods were used to determine the concentration of Cl in mg/L, and the results are shown in the following table: Sample Method A Method B 0.36 1.35 0.39 2 0.84 3 1.76 2.56 3.92 3.35 4.69 4 5.35 8.33 10.70 5 6. 7.70 7 10.52 8 10.92 10.91 a. What type of t test should be used to compare the two methods and why? b. Do the two methods give different results? State and test the appropriate hypotheses. c. Does the conclusion depend on whether the 90%, 95%, or 99% confidence levels are used?

Glencoe Algebra 1, Student Edition, 9780079039897, 0079039898, 2018
18th Edition
ISBN:9780079039897
Author:Carter
Publisher:Carter
Chapter10: Statistics
Section10.1: Measures Of Center
Problem 9PPS

Related questions
Topic Video
Question
Transcribed Image Text:Two different analytical methods were used to determine residual chlorine in sewage
effluents. Both methods were used on the same samples, but each sample came from
various locations with differing amounts of contact time with the effluent. Two methods
were used to determine the concentration of Cl in mg/L, and the results are shown in
the following table:
Sample
Method A
Method B
0.36
1.35
2.56
3.92
5.35
1
0.39
2
0.84
3
1.76
3.35
4.69
4
8.33
10.70
7.70
7
10.52
8
10.92
10.91
a. What type of t test should be used to compare the two methods and why?
b. Do the two methods give different results? State and test the appropriate
hypotheses.
Does the conclusion depend on whether the 90%, 95%, or 99% confidence levels
с.
are used?
Expert Solution
This question has been solved!
Explore an expertly crafted, step-by-step solution for a thorough understanding of key concepts.

This is a popular solution!

Trending now
This is a popular solution!

Step by step
Solved in 3 steps

Knowledge Booster


Learn more about
Need a deep-dive on the concept behind this application? Look no further. Learn more about this topic, statistics and related others by exploring similar questions and additional content below.Recommended textbooks for you
Glencoe Algebra 1, Student Edition, 9780079039897…
Algebra
ISBN:
9780079039897
Author:
Carter
Publisher:
McGraw Hill
Glencoe Algebra 1, Student Edition, 9780079039897…
Algebra
ISBN:
9780079039897
Author:
Carter
Publisher:
McGraw Hill