*- cer pua page dn page up delete Name 8 6. Date Block Score Graphing Motion Lab Coar. The goal of this lab is to draw conclusions about motion graphs and practice graphing motion. mtroduction: Motion graphs are important to understand how objects are moving. In this lab activity, we will create motion graphs from motion diagrams and from description situations. O8 ) = 1 s こ=} as 9 =1 8. Feet 4. 12 FIGURE 1-9 Motion diagram of a skateboarder, showing position and time. Part 1: Motion Diagrams Basics Instead of graphing from a data table, we will be graphing from a motion diagram. The diagram below shows Harold running from 0m to 100m on the track. He is moving along the positions, shown on the number line and his time at each position is tracked above him. Using these values, first create a data table. Then graph the motion (using time on the x and position on the y). Lor on Ceu 0 10 20 30 40 50 60 70 80 90 100 0 10 S0 2. 5 pua Data Table: eive Time Distance 6. 15 K 25 Is Harold moving toward or away from the origin (zero)? Is the slope positive or negative? Finish this statement: If a slope is positive on a motion graph then... Below there is a motion diagram of Hannah running from 100m to Om. Create a motion graph using the data from the graph. You can create a data table if it will help you! 0 10 20 30 40 50 60 70 80 90 100
*- cer pua page dn page up delete Name 8 6. Date Block Score Graphing Motion Lab Coar. The goal of this lab is to draw conclusions about motion graphs and practice graphing motion. mtroduction: Motion graphs are important to understand how objects are moving. In this lab activity, we will create motion graphs from motion diagrams and from description situations. O8 ) = 1 s こ=} as 9 =1 8. Feet 4. 12 FIGURE 1-9 Motion diagram of a skateboarder, showing position and time. Part 1: Motion Diagrams Basics Instead of graphing from a data table, we will be graphing from a motion diagram. The diagram below shows Harold running from 0m to 100m on the track. He is moving along the positions, shown on the number line and his time at each position is tracked above him. Using these values, first create a data table. Then graph the motion (using time on the x and position on the y). Lor on Ceu 0 10 20 30 40 50 60 70 80 90 100 0 10 S0 2. 5 pua Data Table: eive Time Distance 6. 15 K 25 Is Harold moving toward or away from the origin (zero)? Is the slope positive or negative? Finish this statement: If a slope is positive on a motion graph then... Below there is a motion diagram of Hannah running from 100m to Om. Create a motion graph using the data from the graph. You can create a data table if it will help you! 0 10 20 30 40 50 60 70 80 90 100

Chapter1: The Study Of Motion
Section: Chapter Questions
Problem 9C

Related questions

Question
Transcribed Image Text:*-
cer
pua
page dn
page up
delete
Name
8
6.
Date
Block
Score
Graphing Motion Lab
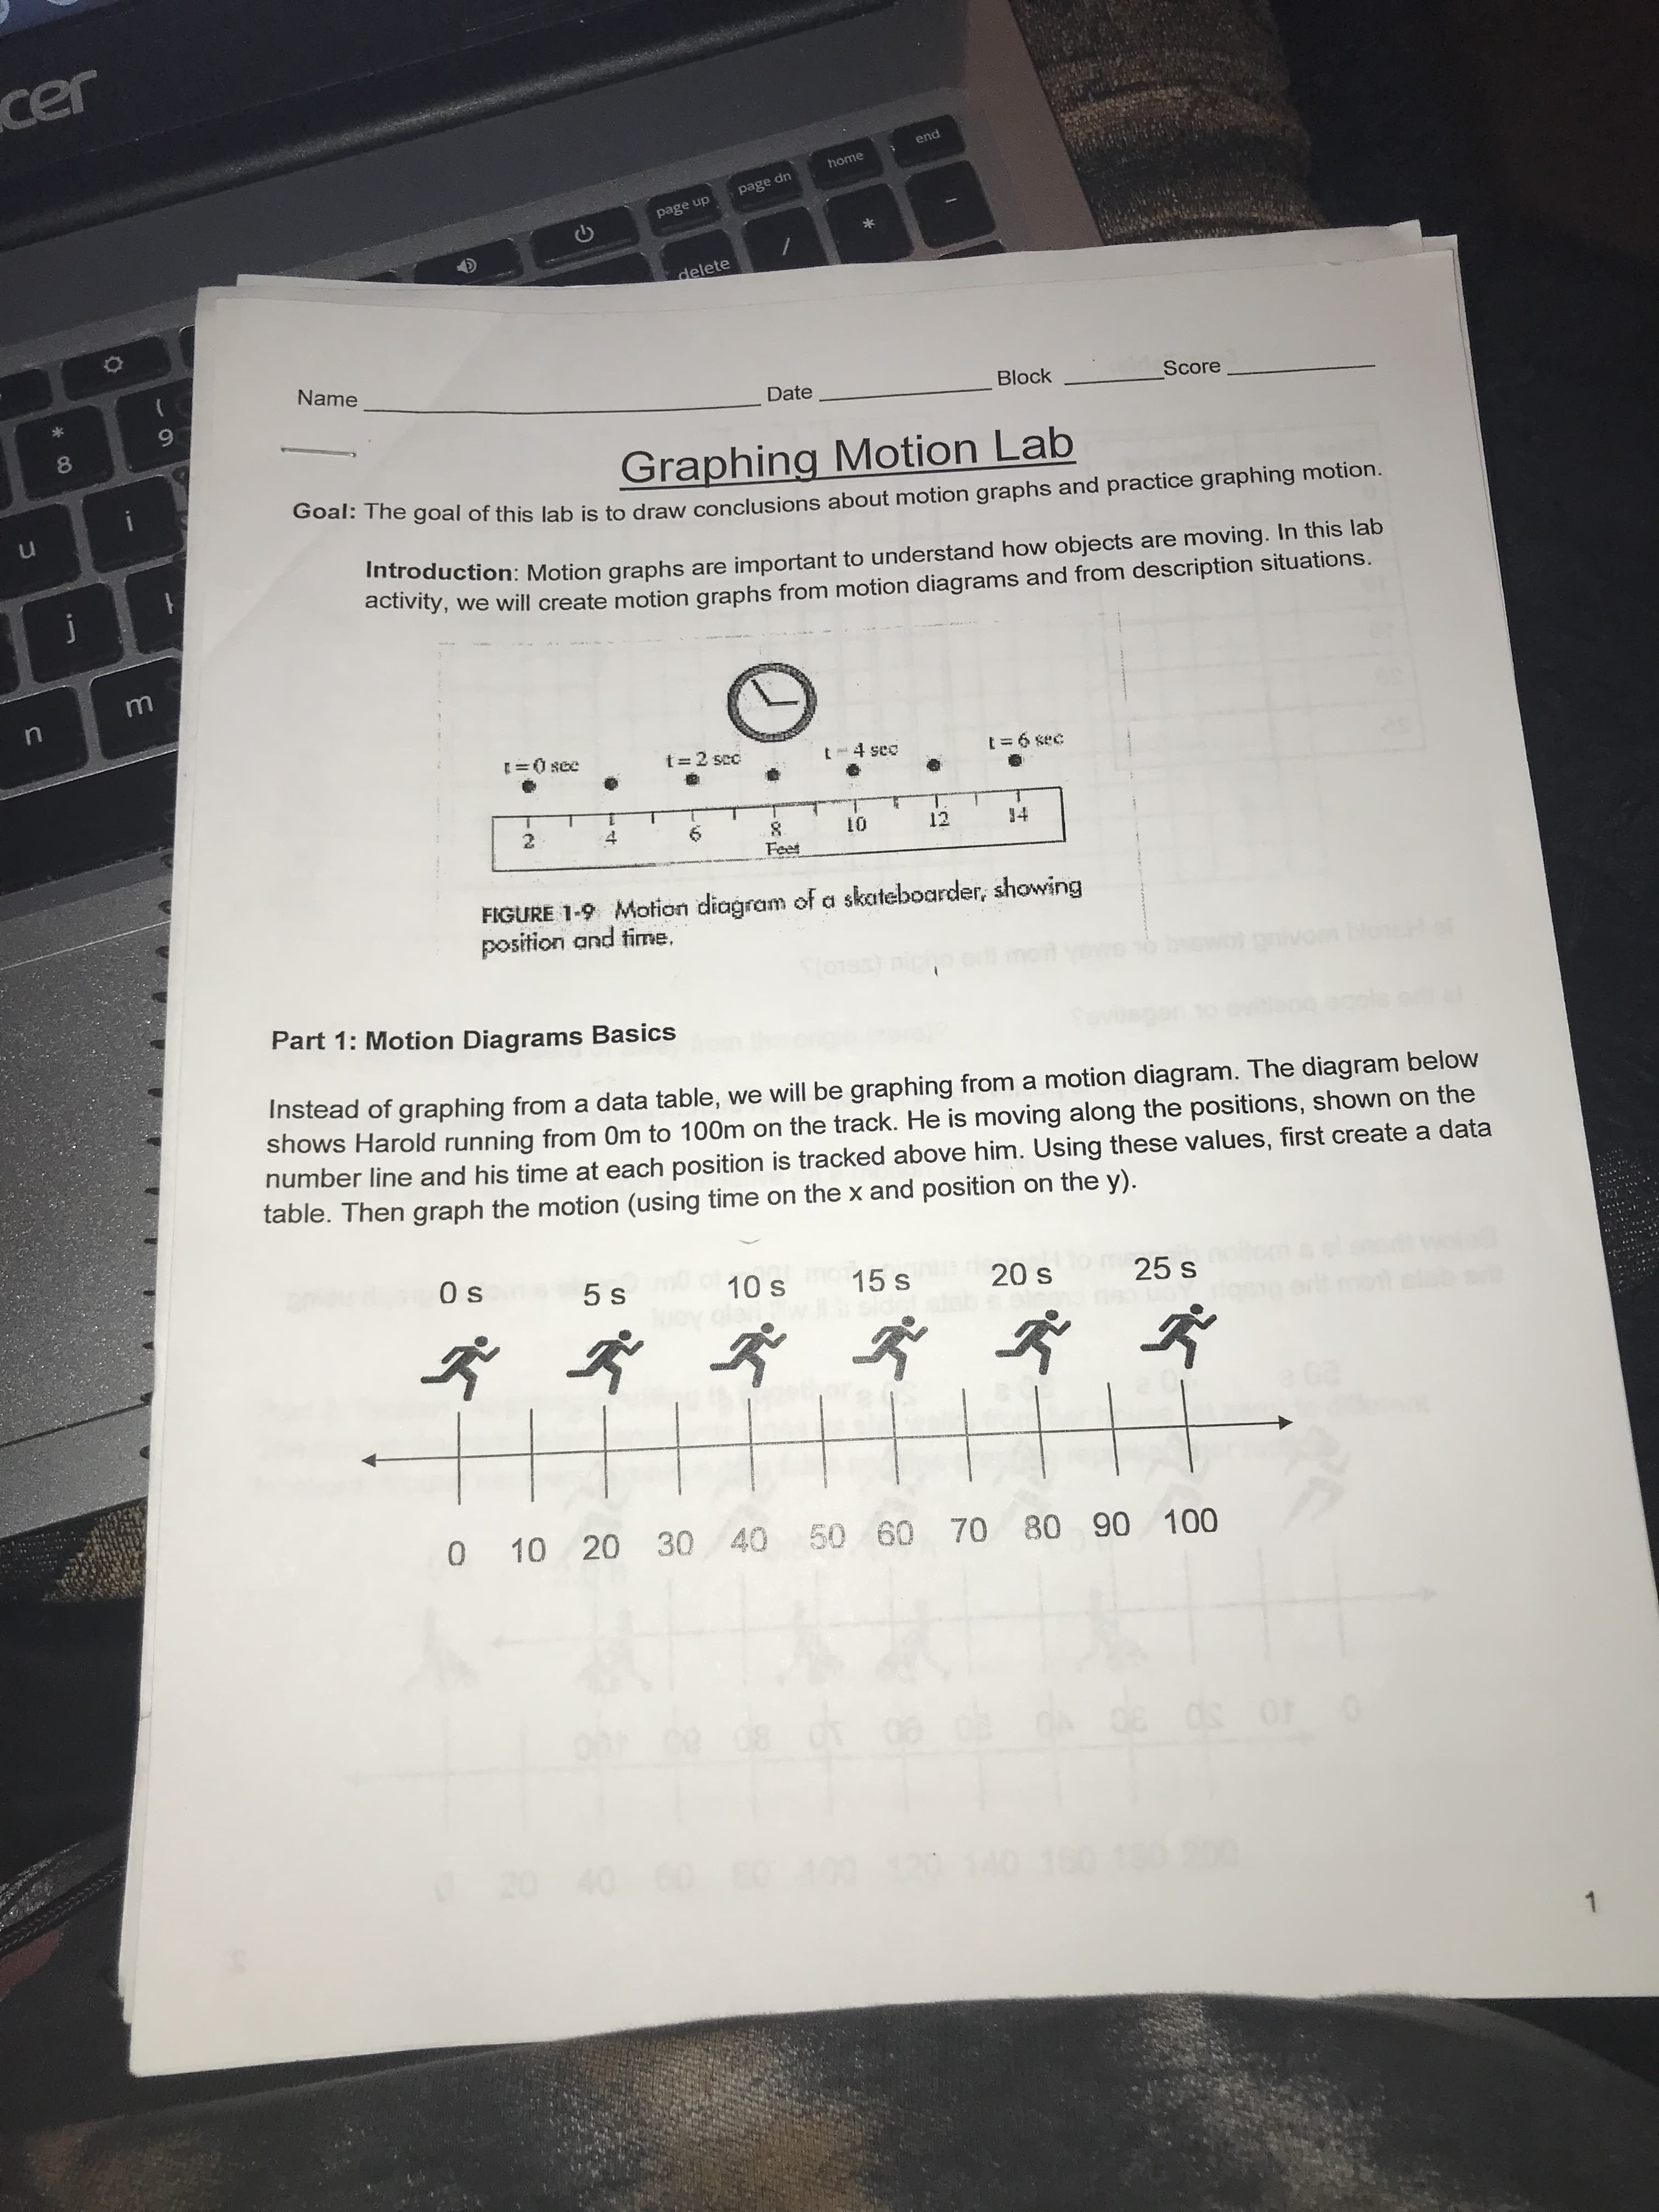
Coar. The goal of this lab is to draw conclusions about motion graphs and practice graphing motion.
mtroduction: Motion graphs are important to understand how objects are moving. In this lab
activity, we will create motion graphs from motion diagrams and from description situations.
O8 ) = 1
s こ=}
as 9 =1
8.
Feet
4.
12
FIGURE 1-9 Motion diagram of a skateboarder, showing
position and time.
Part 1: Motion Diagrams Basics
Instead of graphing from a data table, we will be graphing from a motion diagram. The diagram below
shows Harold running from 0m to 100m on the track. He is moving along the positions, shown on the
number line and his time at each position is tracked above him. Using these values, first create a data
table. Then graph the motion (using time on the x and position on the y).
Lor
on Ceu
0 10 20 30 40
50 60 70 80 90 100
0 10 S0
Transcribed Image Text:2.
5
pua
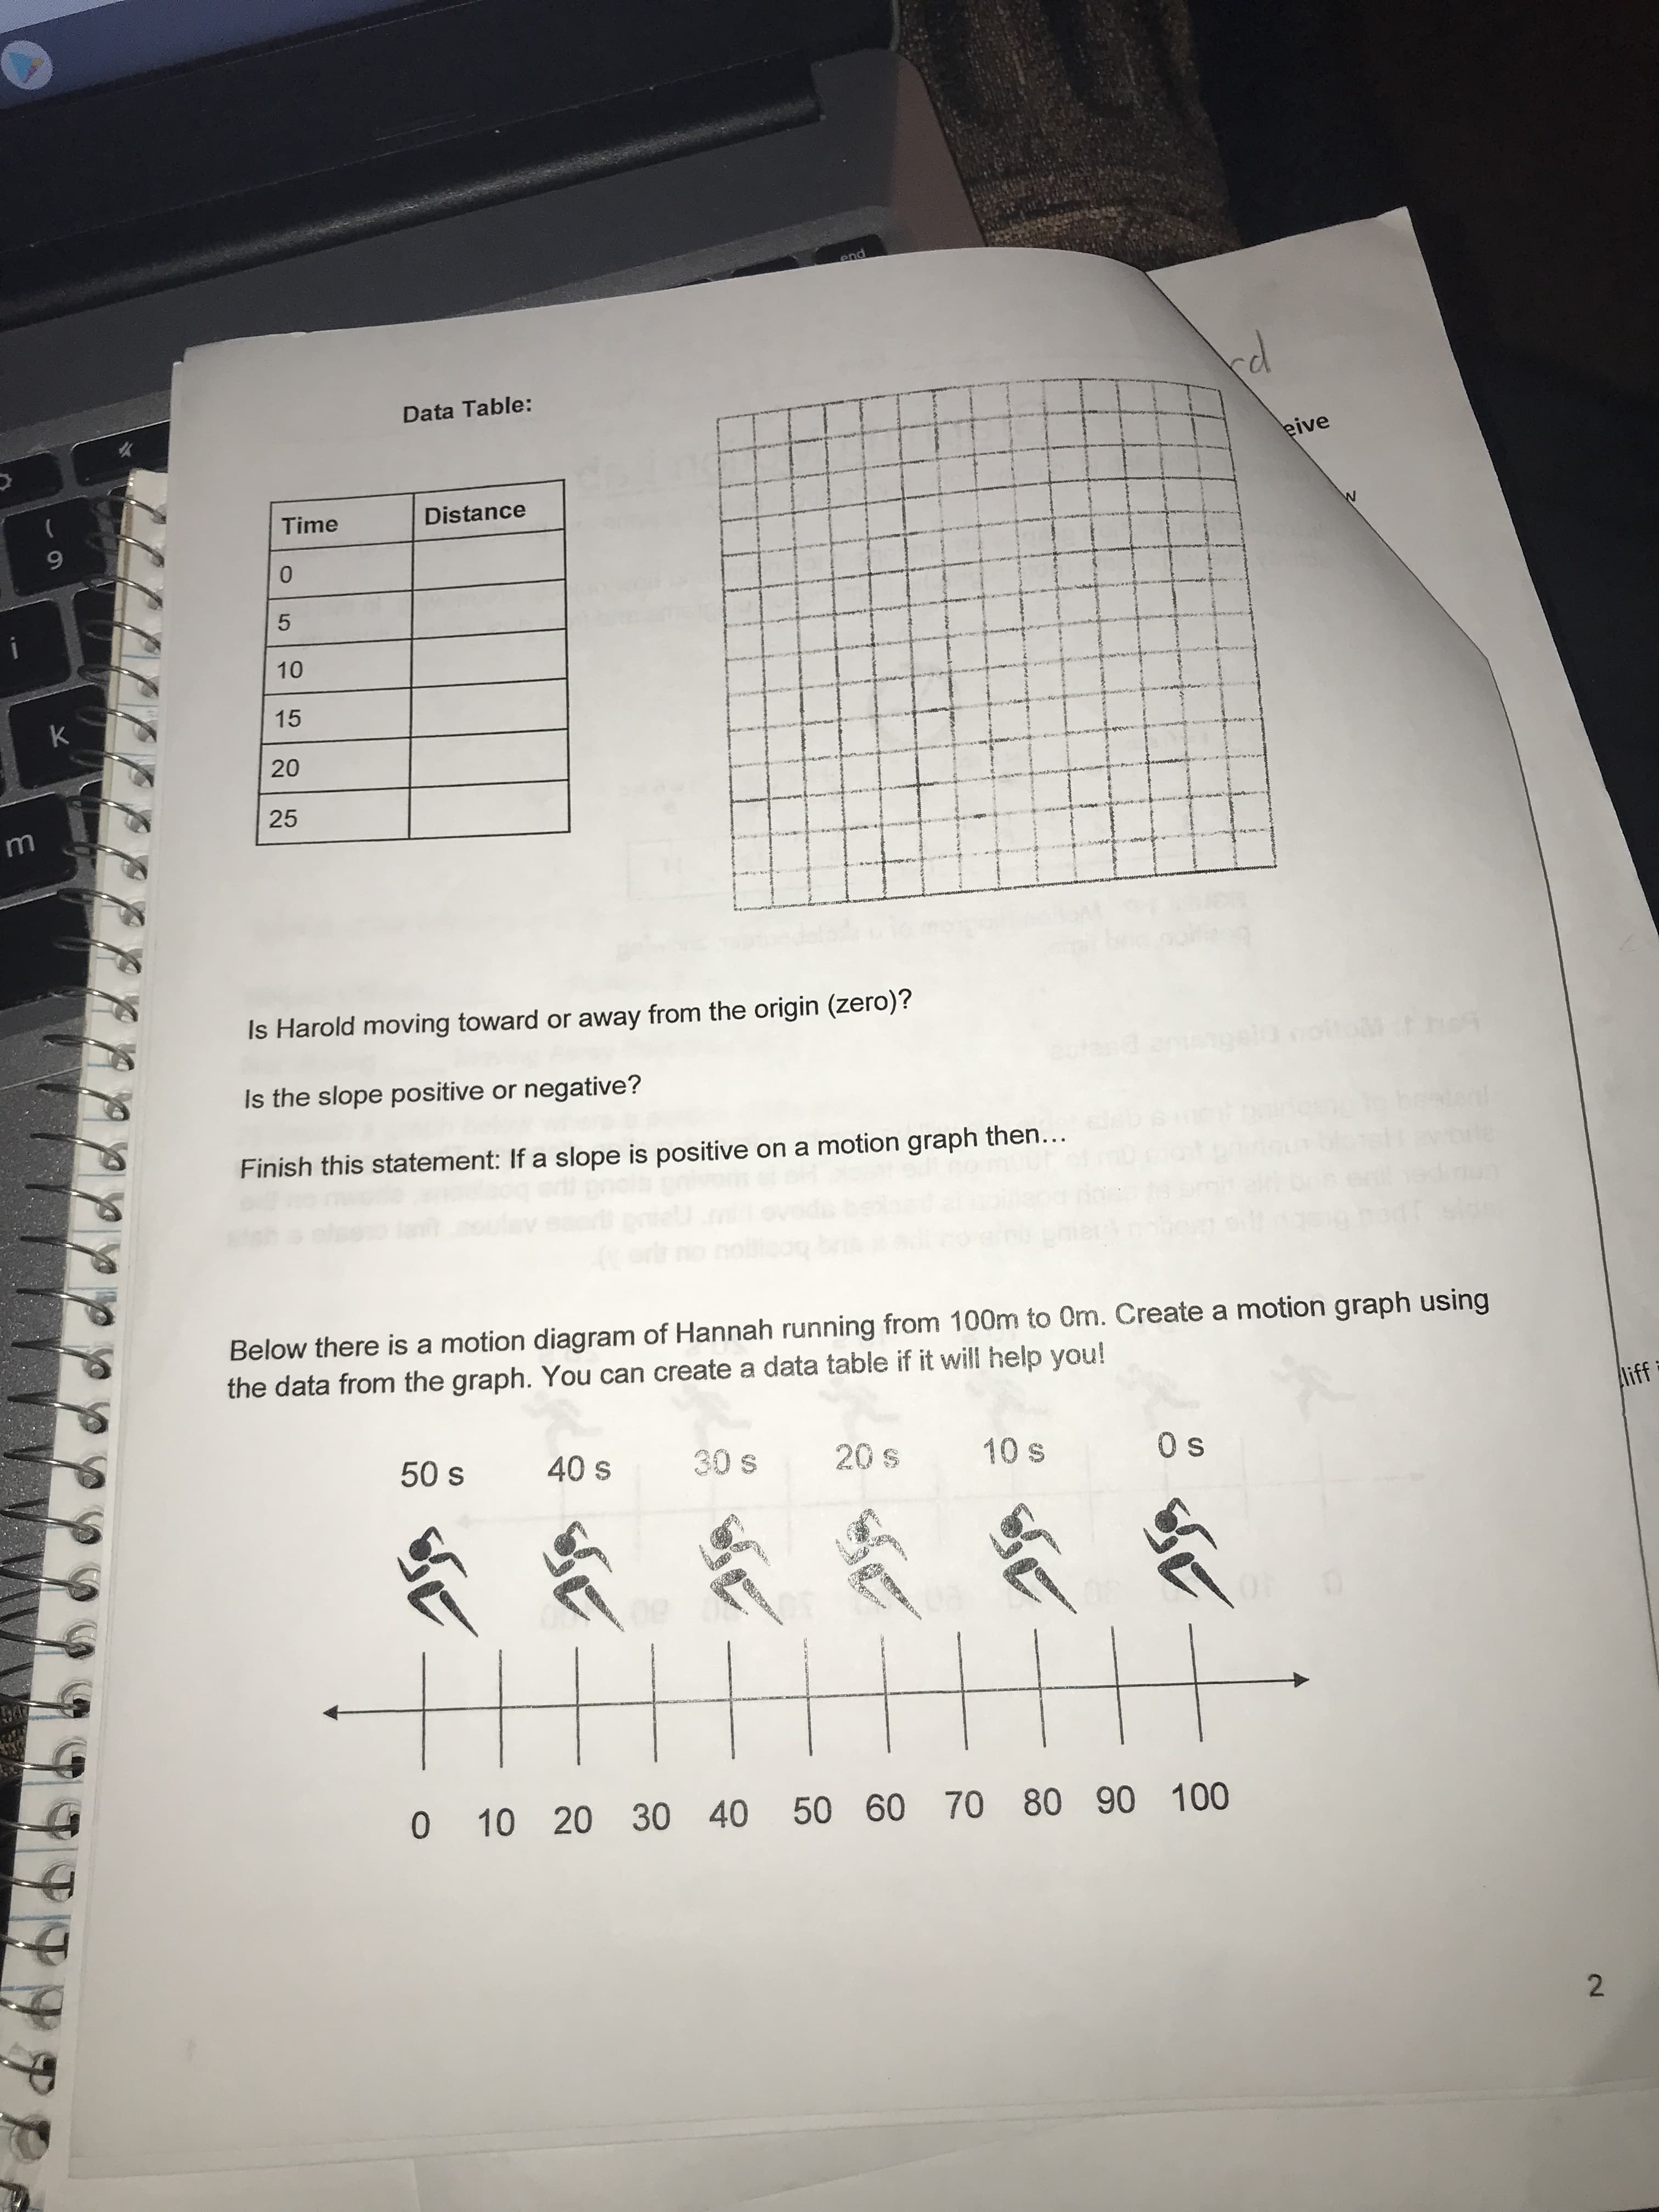
Data Table:
eive
Time
Distance
6.
15
K
25
Is Harold moving toward or away from the origin (zero)?
Is the slope positive or negative?
Finish this statement: If a slope is positive on a motion graph then...
Below there is a motion diagram of Hannah running from 100m to Om. Create a motion graph using
the data from the graph. You can create a data table if it will help you!
0 10 20 30 40 50 60 70 80 90 100
Expert Solution
This question has been solved!
Explore an expertly crafted, step-by-step solution for a thorough understanding of key concepts.

This is a popular solution!

Trending now
This is a popular solution!

Step by step
Solved in 3 steps with 1 images

Knowledge Booster


Learn more about
Need a deep-dive on the concept behind this application? Look no further. Learn more about this topic, physics and related others by exploring similar questions and additional content below.Recommended textbooks for you

Physics for Scientists and Engineers: Foundations…
Physics
ISBN:
9781133939146
Author:
Katz, Debora M.
Publisher:
Cengage Learning

College Physics
Physics
ISBN:
9781938168000
Author:
Paul Peter Urone, Roger Hinrichs
Publisher:
OpenStax College
Physics for Scientists and Engineers: Foundations…
Physics
ISBN:
9781133939146
Author:
Katz, Debora M.
Publisher:
Cengage Learning
College Physics
Physics
ISBN:
9781938168000
Author:
Paul Peter Urone, Roger Hinrichs
Publisher:
OpenStax College

Glencoe Physics: Principles and Problems, Student…
Physics
ISBN:
9780078807213
Author:
Paul W. Zitzewitz
Publisher:
Glencoe/McGraw-Hill

An Introduction to Physical Science
Physics
ISBN:
9781305079137
Author:
James Shipman, Jerry D. Wilson, Charles A. Higgins, Omar Torres
Publisher:
Cengage Learning