Pick a reasonable value for your independent variable to make a prediction of the dependent variable. How do you know this is a reasonable value?Using the excel equation and your chosen value, make a prediction for your dependent variable – MAKE SURE TO SHOW WORK. Using your chosen value and the predicted value, explain what information this tells you. Based on all of the previous tasks, do you feel that your prediction is reliable – why or why not
Pick a reasonable value for your independent variable to make a prediction of the dependent variable. How do you know this is a reasonable value?Using the excel equation and your chosen value, make a prediction for your dependent variable – MAKE SURE TO SHOW WORK. Using your chosen value and the predicted value, explain what information this tells you. Based on all of the previous tasks, do you feel that your prediction is reliable – why or why not

MATLAB: An Introduction with Applications
6th Edition
ISBN:9781119256830
Author:Amos Gilat
Publisher:Amos Gilat
Chapter1: Starting With Matlab
Section: Chapter Questions
Problem 1P

Related questions
Question
Pick a reasonable value for your independent variable to make a prediction of the dependent variable. How do you know this is a reasonable value?Using the excel equation and your chosen value, make a prediction for your dependent variable – MAKE SURE TO SHOW WORK. Using your chosen value and the predicted value, explain what information this tells you. Based on all of the previous tasks, do you feel that your prediction is reliable – why or why not?
Transcribed Image Text:35
30
25
20
15
10
5
0
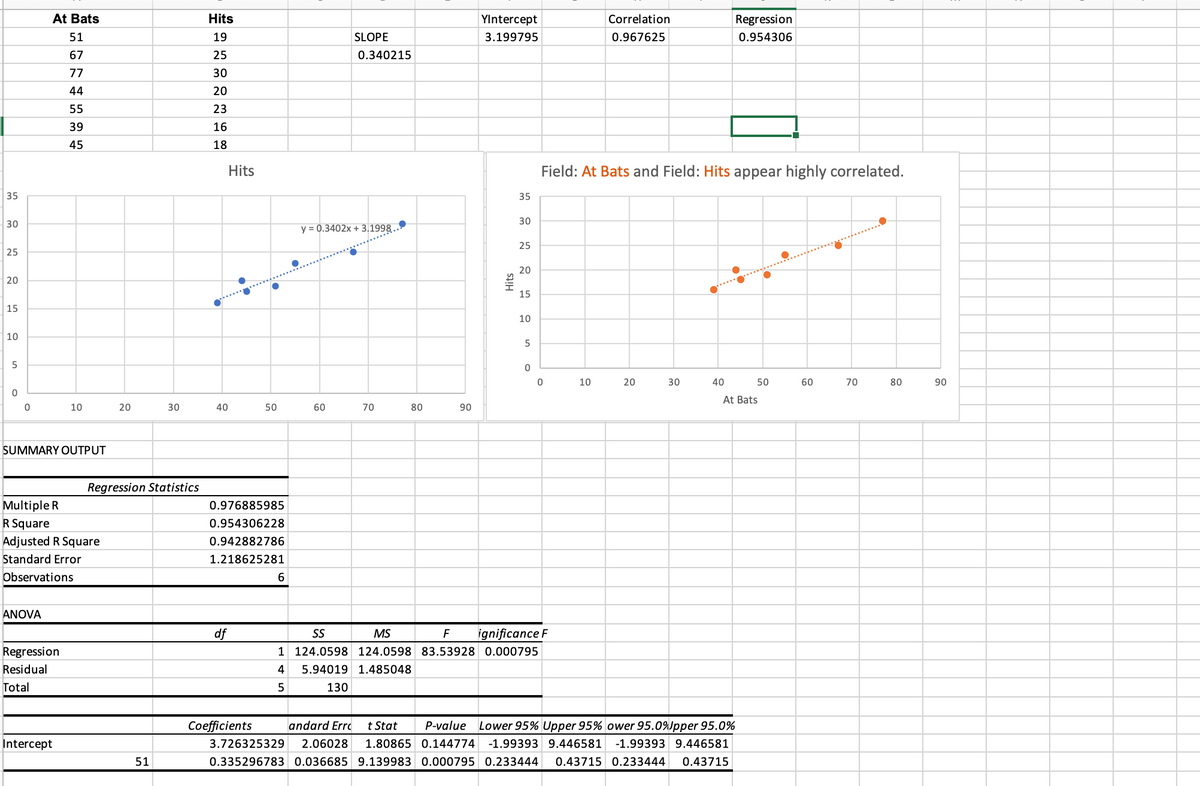
At Bats
51
67
77
44
55
39
45
0
10
SUMMARY OUTPUT
Multiple R
R Square
Adjusted R Square
Standard Error
Observations
ANOVA
Regression
Residual
Total
Intercept
20
30
Regression Statistics
Hits
19
25
30
20
23
16
18
Hits
40
SLOPE
0.340215
y = 0.3402x + 3.1998..
60
70
80
YIntercept
3.199795
90
Correlation
Regression
0.967625
0.954306
Field: At Bats and Field: Hits appear highly correlated.
35
30
25
20
15
10
5
0
20
30
40
50
60
70
80
Hits
At Bats
50
0.976885985
0.954306228
0.942882786
1.218625281
6
df
SS
MS
F
ignificance F
1 124.0598 124.0598 83.53928 0.000795
4
5.94019 1.485048
5
130
Coefficients andard Erro t Stat P-value Lower 95% Upper 95% ower 95.0%Jpper 95.0%
3.726325329 2.06028 1.80865 0.144774 -1.99393 9.446581 -1.99393 9.446581
0.335296783 0.036685 9.139983 0.000795 0.233444 0.43715 0.233444 0.43715
51
0
10
90
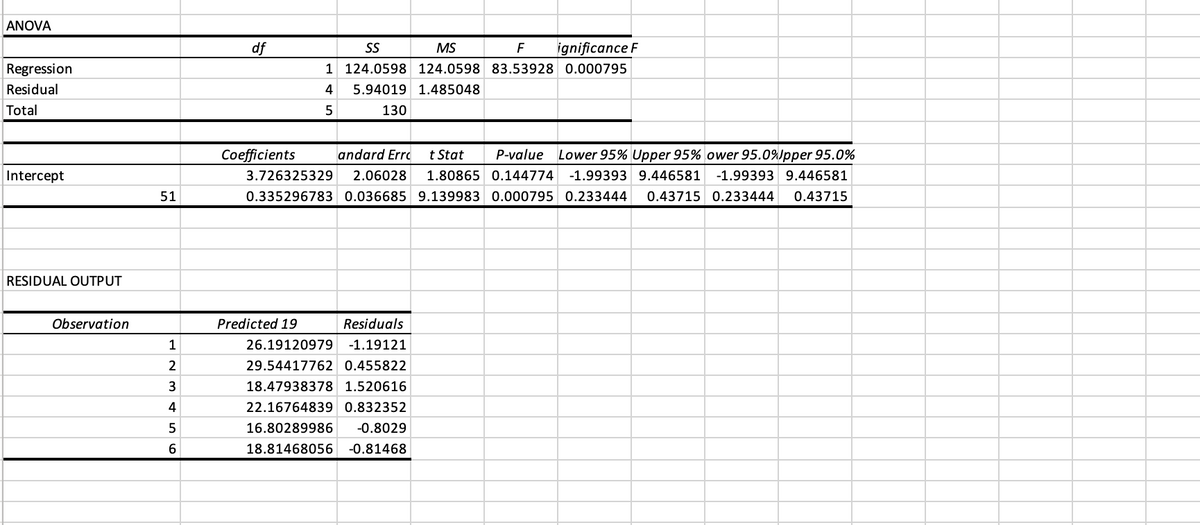
Transcribed Image Text:ANOVA
Regression
Residual
Total
Intercept
RESIDUAL OUTPUT
Observation
51
1
2
3
4
5
6
df
SS
MS
F
ignificance F
1 124.0598 124.0598 83.53928 0.000795
4
5.94019 1.485048
5
130
Coefficients
andard Erro t Stat P-value Lower 95% Upper 95% ower 95.0%Jpper 95.0%
3.726325329 2.06028 1.80865 0.144774 -1.99393 9.446581 -1.99393 9.446581
0.335296783 0.036685 9.139983 0.000795 0.233444 0.43715 0.233444 0.43715
Predicted 19
Residuals
26.19120979 -1.19121
29.54417762 0.455822
18.47938378 1.520616
22.16764839 0.832352
16.80289986 -0.8029
18.81468056 -0.81468
Expert Solution
This question has been solved!
Explore an expertly crafted, step-by-step solution for a thorough understanding of key concepts.

This is a popular solution!

Trending now
This is a popular solution!

Step by step
Solved in 3 steps

Recommended textbooks for you
MATLAB: An Introduction with Applications
Statistics
ISBN:
9781119256830
Author:
Amos Gilat
Publisher:
John Wiley & Sons Inc

Probability and Statistics for Engineering and th…
Statistics
ISBN:
9781305251809
Author:
Jay L. Devore
Publisher:
Cengage Learning

Statistics for The Behavioral Sciences (MindTap C…
Statistics
ISBN:
9781305504912
Author:
Frederick J Gravetter, Larry B. Wallnau
Publisher:
Cengage Learning
MATLAB: An Introduction with Applications
Statistics
ISBN:
9781119256830
Author:
Amos Gilat
Publisher:
John Wiley & Sons Inc
Probability and Statistics for Engineering and th…
Statistics
ISBN:
9781305251809
Author:
Jay L. Devore
Publisher:
Cengage Learning
Statistics for The Behavioral Sciences (MindTap C…
Statistics
ISBN:
9781305504912
Author:
Frederick J Gravetter, Larry B. Wallnau
Publisher:
Cengage Learning

Elementary Statistics: Picturing the World (7th E…
Statistics
ISBN:
9780134683416
Author:
Ron Larson, Betsy Farber
Publisher:
PEARSON

The Basic Practice of Statistics
Statistics
ISBN:
9781319042578
Author:
David S. Moore, William I. Notz, Michael A. Fligner
Publisher:
W. H. Freeman

Introduction to the Practice of Statistics
Statistics
ISBN:
9781319013387
Author:
David S. Moore, George P. McCabe, Bruce A. Craig
Publisher:
W. H. Freeman