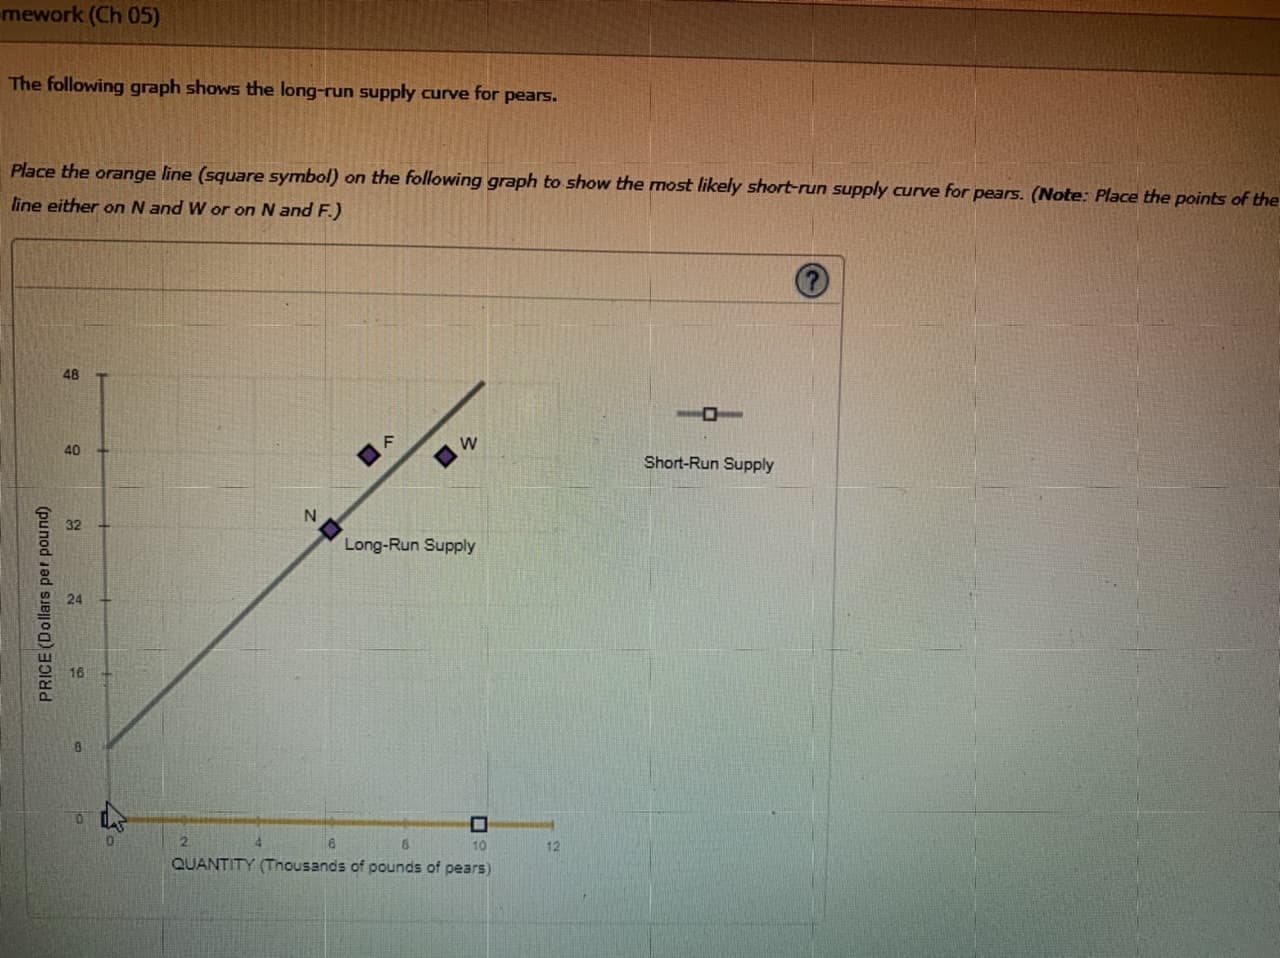
Place the orange line (square symbol) on the following graph to show the most likely short-run supply curve for pears. (Note: Place the points of the line either on N and W or on N and F.)


Q: On the following graph, use the orange points (square symbol) to plot the portion of the firm's…
A:
Q: Given that the total cost= the firm is q=150P+30. 1 59³ − 0.2q² + q +40, the short-run supply…
A: We have given cost function and a firm produces output where P=Mc
Q: PRICE (Dollars per quart) Short-run Subply Demand Short-run Supply Short-run Equilbrium Demand…
A: The curve that depicts various quantities of goods and services being demanded at various price…
Q: Consider the equilibrium depicted as your final short-run equilibrium (SRE). Is your price depicted…
A: A perfect market, sometimes known as an atomistic market, is defined by various idealising…
Q: Factors that cause the short-run supply curve to change are factors that affect
A: In the short run supply can be able to change with limited resources.
Q: The long-run supply curve indifferent cost industries The following graph shows the market for milk.…
A: Answer -
Q: You are the manager and selling your product in a perfectly competitive firm market. Your firm and…
A: Here, it is given that a firm operates its business in the perfectly competitive market with market…
Q: At that price ($3), what is the profit that Farmer Johnson earns in the short- run? (Please enter…
A: Total cost = Average total cost * quantity Total revenue = Price * quantity Profit = Total revenue -…
Q: Explain why a long-run supply curve might slope upward.
A: The supply curve indicates the relationship between price and quantity supplied by the firms.
Q: The following figure shows the supply function of a firm. (The following is a description of the…
A: A surplus of producers is a measure of producer welfare if the firm sells q2.
Q: The slow recovery from the recession of 2007–2009 forced many firms to develop new competitive…
A: The slow recovery from the recession of 2007-2009 disincentivized firms to lend from financial…
Q: Place the orange line (square symbol) on the following graph to show the most likely long-run supply…
A: The long-run is the more elastic period in the short run as the producer can adjust the factors of…
Q: What determines the slope of the Market Supply Curve over the long run? Discuss some reasons why it…
A: The market supply bend/curve is an upward sloping bend portraying the positive connection between…
Q: In the short run, firms wil, In the long run, the supply curve wil On the preceding graph, show the…
A: The constant cost industry is the industry; the exit of the firm will not affect the input prices of…
Q: Widget Corp.'s production function is given by q = 3K + 2L. (b)Find Widget Corp.'s short-run supply…
A: Short Run refers to that time frame in which some factors of production cannot be varied and are…
Q: Place the orange line (square symbol) on the following graph to show the most likely short-run…
A: The Short-Run Supply curve for apricots is shown by the orange line.
Q: Suppose there are 10 firms in this market, each of which has the cost curves previously shown. On…
A: Upward sloping of Marginal cost curve is the supply. Firm will supply above average variable cost…
Q: You are the manager and selling your product in a perfectly competitive firm market. Your firm and…
A: Given C(Q) = 50 + 10Q + 2 Q2, MC = Change in Total Cost/ Change in Output = 50 + 10Q + 2 Q2 / Q…
Q: The following graph shows the market demand for wheat. 1. Use the orange points (square symbol) to…
A: In perfect competition, the short-run supply curve is the rising part of the MC curve above the…
Q: Price elasticity of supply in the short run and long run The following graph shows the long-run…
A: Price elasticity of supply refers to the percentage change in the supply of goods and services to a…
Q: What is The position of the long run Philips curve is determined by
A: Philips Curve: This is the curve that shows the relationship between the inflation rate and the…
Q: The following diagram shows the market demand for steel. Use the orange points (square symbol) to…
A: Note: Since the original question contains more than three subparts, we are going to answer first…
Q: “The firm’s entire marginal cost curve is its short-run supply curve.” Is the preceding statement…
A: Marginal cost curve represents the change in total cost with the change in output produced.
Q: The following graph shows the market for tortilla chip. Initially, the market is in a long-run…
A: A market is a place where the buyers and sellers interact with each other and the exchange of goods…
Q: Under what conditions would a firm decide to shut down in the short run but remain invested in the…
A: In a market, a firm faces different situations in short-run and long-run due to which it makes…
Q: consider the market for corn in August 2020, a period where grain prices were quite low and the…
A: One consider the market for corn in august 2020 and find the short run equilibrium in the…
Q: Use the orange points (square symbol) to plot the short-run industry supply curve for the wheat…
A: We are going to find short run profit maximisation condition to answer this question.
Q: The following graph shows the short-run supply curve for pears. Place the orange line (square…
A: There used to be differences in the short-run and long-run supply curve due to changes in the nature…
Q: The following graph shows the market demand for wheat. Use the orange points (square symbol) to plot…
A: Answer: In the short run, the supply curve is the rising part of the marginal cost (MC) curve above…
Q: For a perfectly competitive firm to operate and produce an output level in the short-run, the firm's…
A: A perfectly competitive market is a price taker as there are many firms in the market and no firm…
Q: The graphs suggest that in the long run, assuming no changes in the given information,
A:
Q: The following graph shows the short-run supply curve for pears. Place the orange line (square…
A: Supply curve is an upward sloping curve. It shows positive relationship between price and quantity…
Q: Many firms in the United States file for bankruptcy every year, yet they still continue operating.…
A: Filling for bankruptcy does not mean that the firms have to shut down. In the US the bankruptcy laws…
Q: Using the information on the slope of the lines tangent to the curve at points B and D, plot the…
A: The slope of a curve represents the curve's direction and steepness at a particular point. It refers…
Q: where a, b, c, and d are constants. The equation for the long-run demand curve is A.Q=47.50-0.15P.…
A: The long-run equilibrium point for a perfectly competitive market occurs where the demand curve…
Q: Briefly define the short run and long run supply curve?
A: The supply curve is a graphical representation that describes the relationship between the price and…
Q: Refer to Figure 12-11. Suppose the prevailing price is $20 and the firm is currently producing 1,350…
A: Answer: Given that: Suppose the prevailing price is $20 and the firm is currently…
Q: The following graph shows the long-run supply curve for persimmons. Place the orange line (square…
A: "Supply curve for a product depicts a positive relationship between the price of the product and…
Q: Describe the two conditions necessary for attaining equilibrium for a firm in the shortrun.
A: 1. MR = MC This is a necessary but not sufficient condition.
Q: 2. Based on your answer in 1, identify two key features of long run equilibrium and determine the…
A: Answer: The two key features associated with long-run equilibrium are given as: (1). In the long…
Q: The following graph shows the market demand for wheat. Use the orange points (square symbol) to plot…
A: Demand curve: It can be defined as the graphical presentation of the law of demand which depicts an…
Q: Determine whether each of the statement is true, false, or uncertain. If the statement is false or…
A: Economies of scale means production at large which reduces the per unit cost of firm .


Trending now
This is a popular solution!

Step by step
Solved in 2 steps with 1 images


- The following graph shows the long-run supply curve for pears. Place the orange line (square symbol) on the following graph to show the most likely short-run supply curve for pears. (Note: Place the points of the line either on I and F or on I and C.) Note:- Do not provide handwritten solution. Maintain accuracy and quality in your answer. Take care of plagiarism. Answer completely. You will get up vote for sure.Explain why a long-run supply curve might slope upward.Distinguish between short-run and long-run supply curves.
- Then, plot points along the portion of the firm's short-run supply curve that corresponds to prices where there is positive output.Which point or points on the figure at right illustrate a short-run equilibrium? A. Point A B. Point B C. Point C D. Points A and CRefer to Figure 10.1 for the following questions. Figure 10.1 In Figure 10.1, which of the points are possible long-run equilibriums? Select one: a. A and B b. A and C c. A and D d. B and D
- Determine whether each of the statement is true, false, or uncertain. If the statement is false or uncertain, please correct the statement to make it true. If the statement is true, please explain your answer briefly. Give a brief definition of any underlined term. Economies of scale causes the long-run market supply curve to rise as price increases.Discuss why the long-run ATC curve is generally U-shapedWhat is the LAW OF DIMINISHING RETURNS, and why is this law considered a short-run phenomenon?
- In 2016, Netflix increased prices for their U.S. subscribers from $7.99 to $9.99 per month.1Following the price increase, the rate of subscription growth decreased significantly, from 1.56 (in the fourth quarter of 2015, before implementing the price increase) to 0.40 (in the third quarter of 2016, after implementing the price increase). In addition, the stock price of the company fell by about 16% (price dropped in July 2016, after releasing the second quarter earnings, to $85.84 per share, from $102.23 on March 31, 2016). How much is the price elasticity of demand for Netflix subscription in this case, using the midpoint method when calculating the percentage change.What are the similarities and differences between a short-run supply curve and a short-run market supply curve?consider the market for corn in August 2020, a period where grain prices were quite low and the market for corn was in a short-run equilibrium. Draw a graph that shows supply and demand analysis for corn in August 2020 (put P on the vertical axis and Q on the horizontal axis). This graph will serve as a starting point for your analysis in Questions 2 and 3.In drawing this graph, please assume that the demand curve is downward sloping and supply curve is upward sloping Clearly show the market equilibrium in August 2020. Label the supply curve as S0; demand curve as D0; the equilibrium price as P0; and equilibrium quantity as Q0.