Please answer part c of this question in image

MATLAB: An Introduction with Applications
6th Edition
ISBN:9781119256830
Author:Amos Gilat
Publisher:Amos Gilat
Chapter1: Starting With Matlab
Section: Chapter Questions
Problem 1P

Related questions
Question
100%
Please answer part c of this question in image
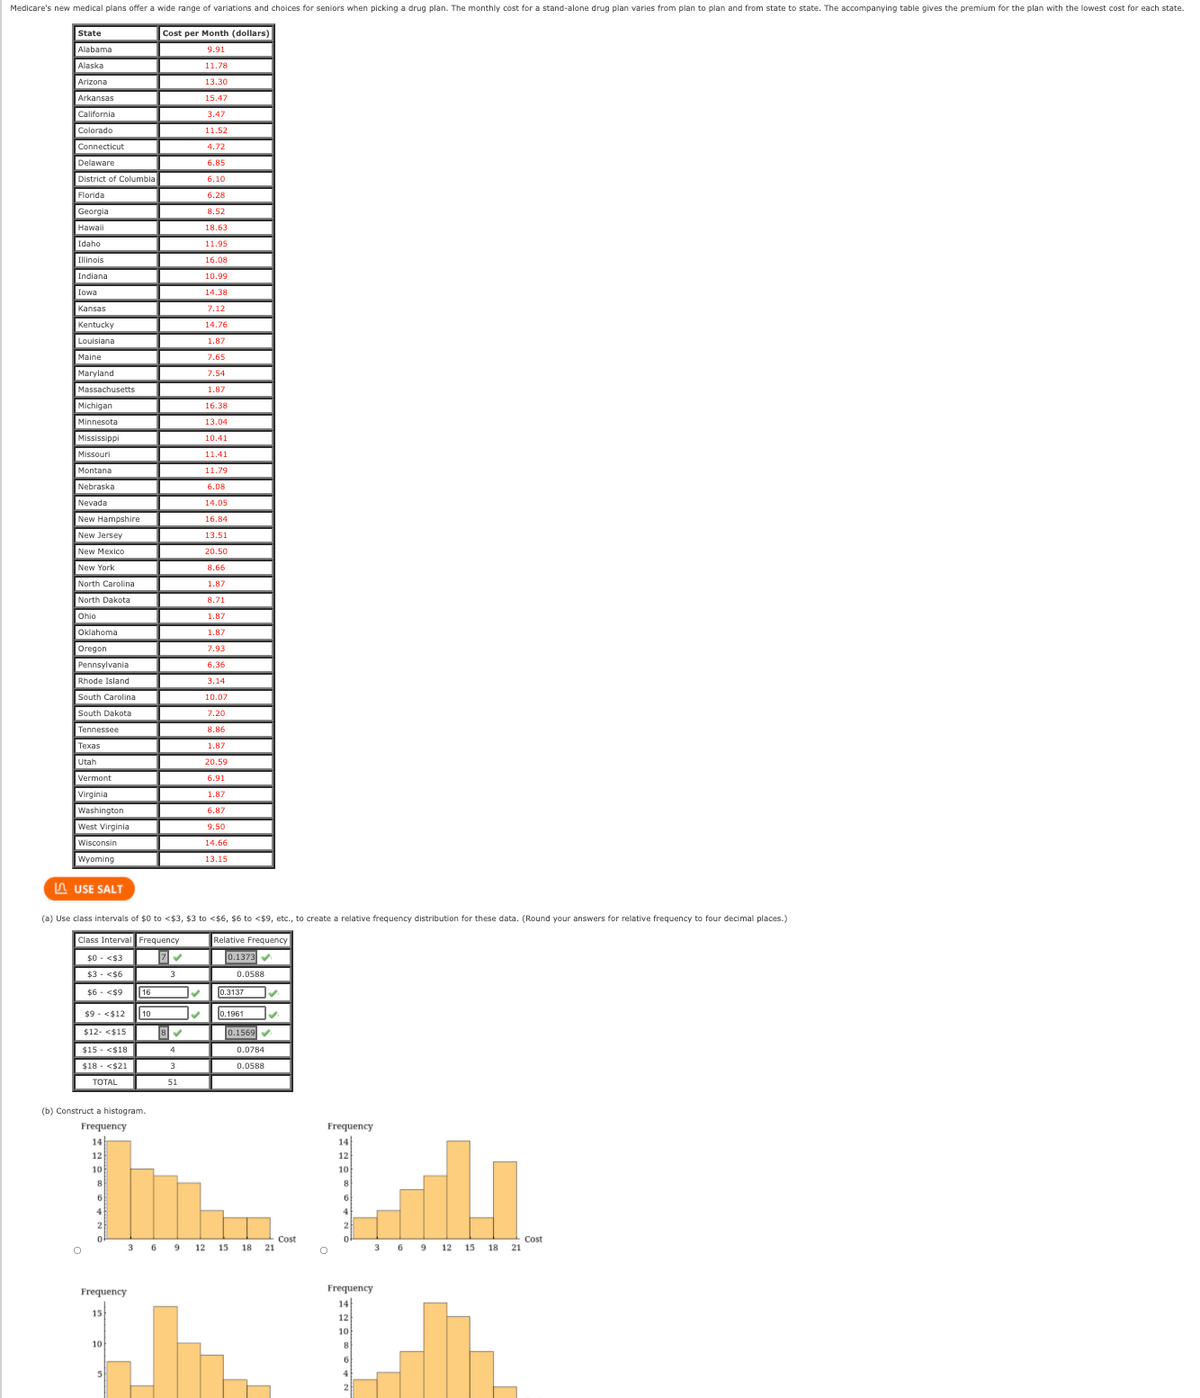
Transcribed Image Text:Medicare's new medical plans offer a wide range of variations and choices for seniors when picking a drug plan. The monthly cost for a stand-alone drug plan varies from plan to plan and from state to state. The accompanying table gives the premium for the plan with the lowest cost for each state.
State
Cost per Month (dollars)
Alabama
9.91
Alaska
11.78
Arizona
13.30
Arkansas
15.47
California
3.47
Colorado
11.52
Connecticut
4.72
Delaware
6.85
District of Columbia
6.10
Florida
6.28
Georgia
8.52
Hawaii
18.63
Idaho
11.95
Illinois
16.08
Indiana
10.99
Iowa
14.38
Kansas
7.12
Kentucky
14.76
Louisiana
1.87
Maine
7.65
Maryland
7.54
Massachusetts
1.87
Michigan
16.38
Minnesota
13.04
Mississippi
10.41
Missouri
11.41
Montana
11.79
Nebraska
6.08
Nevada
14.05
New Hampshire
16.84
New Jersey
13.51
New Mexico
20.50
New York
8.66
North Carolina
1.87
North Dakota
8.71
Ohio
1.87
Oklahoma
1.87
Oregon
7.93
Pennsylvania
6.36
Rhode Island
3.14
South Carolina
10.07
South Dakota
7.20
Tennessee
8.86
Texas
1.87
Utah
20.59
Vermont
6.91
Virginia
1.87
Washington
6.87
West Virginia
9.50
Wisconsin
14.66
Wyoming
13.15
A USE SALT
(a) Use class intervals of $0 to <$3, $3 to <$6, $6 to <$9, etc., to create a relative frequency distribution for these data. (Round your answers for relative frequency to four decimal places.)
Class Interval Frequency
Relative Frequency
$0 - <$3
0.1373
$3 - <$6
3
0.0588
$6 - <$9
16
0.3137
$9 - <$12
| 10
0.1961
$12- <$15
0.1569
$15 - <$18
0.0784
$18 - <$21
3
0.0588
TOTAL
51
(b) Construct a histogram.
Frequency
Frequency
14
14
12
12
10
10
2
2
3 6
Cost
21
6 9
Cost
21
9
12
15 18
3
12
15
18
Frequency
Frequency
14
15
12
10
10
5
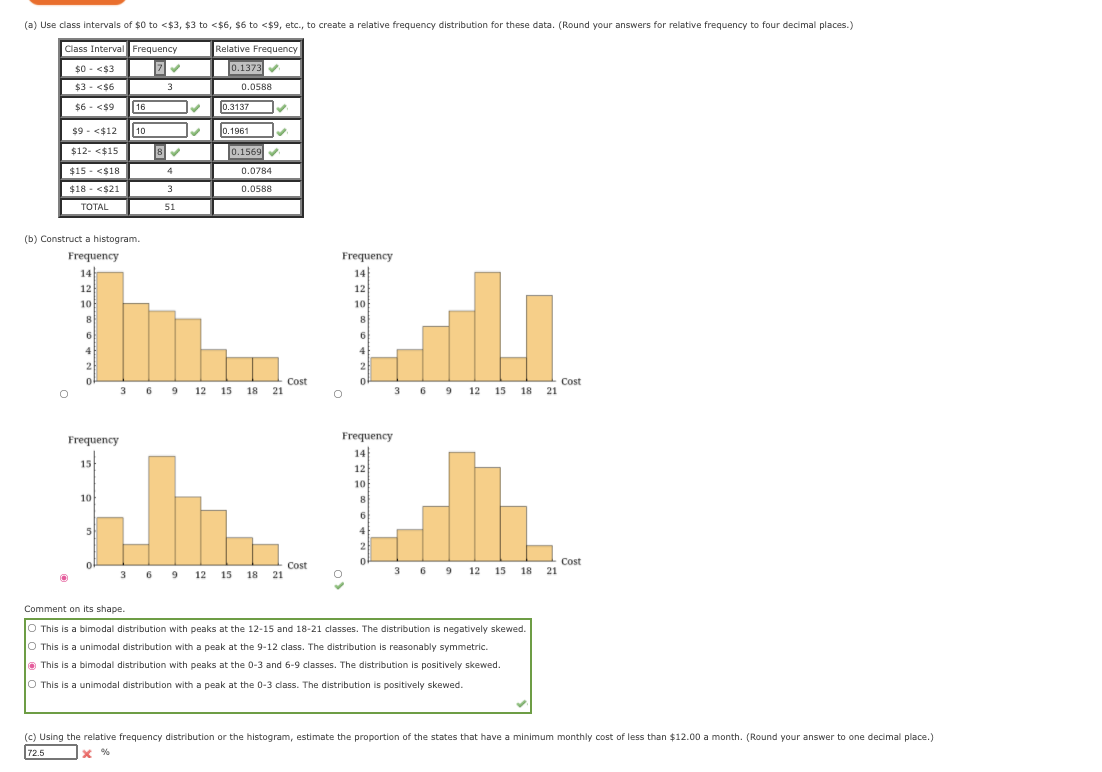
Transcribed Image Text:(a) Use class intervals of $0 to <$3, $3 to <$6, $6 to <$9, etc., to create a relative frequency distribution for these data. (Round your answers for relative frequency to four decimal places.)
Class Interval Frequency
Relative Frequency
$0 - <$3
0.1373
$3 - <$6
3
0.0588
$6 - <$9
16
0.3137
$9 - <$12
10
0.1961
$12- <$15
0.1569
$15 - <$18
0.0784
4
$18 - <$21
3
0.0588
TOTAL
51
(b) Construct a histogram.
Frequency
Frequency
14
14
12
12
10
10
8
8
6
6
4
4
2
2
of
Cost
Cost
3 6 9 12 15 18 21
3 6 9 12 15 18 21
Frequency
Frequency
14
15
12
10
10
8
4
2
Cost
3 6 9 12 15 18 21
Cost
3 6 9 12 15 18 21
Comment on its shape.
O This is a bimodal distribution with peaks at the 12-15 and 18-21 classes. The distribution is negatively skewed.
O This is a unimodal distribution with a peak at the 9-12 class. The distribution is reasonably symmetric.
O This is a bimodal distribution with peaks at the 0-3 and 6-9 classes. The distribution is positively skewed.
O This is a unimodal distribution with a peak at the 0-3 class. The distribution is positively skewed.
(c) Using the relative frequency distribution or the histogram, estimate the proportion of the states that have a minimum monthly cost of less than $12.00 a month. (Round your answer to one decimal place.)
72.5
x %
Expert Solution
This question has been solved!
Explore an expertly crafted, step-by-step solution for a thorough understanding of key concepts.

This is a popular solution!

Trending now
This is a popular solution!

Step by step
Solved in 2 steps with 2 images

Recommended textbooks for you
MATLAB: An Introduction with Applications
Statistics
ISBN:
9781119256830
Author:
Amos Gilat
Publisher:
John Wiley & Sons Inc

Probability and Statistics for Engineering and th…
Statistics
ISBN:
9781305251809
Author:
Jay L. Devore
Publisher:
Cengage Learning

Statistics for The Behavioral Sciences (MindTap C…
Statistics
ISBN:
9781305504912
Author:
Frederick J Gravetter, Larry B. Wallnau
Publisher:
Cengage Learning
MATLAB: An Introduction with Applications
Statistics
ISBN:
9781119256830
Author:
Amos Gilat
Publisher:
John Wiley & Sons Inc
Probability and Statistics for Engineering and th…
Statistics
ISBN:
9781305251809
Author:
Jay L. Devore
Publisher:
Cengage Learning
Statistics for The Behavioral Sciences (MindTap C…
Statistics
ISBN:
9781305504912
Author:
Frederick J Gravetter, Larry B. Wallnau
Publisher:
Cengage Learning

Elementary Statistics: Picturing the World (7th E…
Statistics
ISBN:
9780134683416
Author:
Ron Larson, Betsy Farber
Publisher:
PEARSON

The Basic Practice of Statistics
Statistics
ISBN:
9781319042578
Author:
David S. Moore, William I. Notz, Michael A. Fligner
Publisher:
W. H. Freeman

Introduction to the Practice of Statistics
Statistics
ISBN:
9781319013387
Author:
David S. Moore, George P. McCabe, Bruce A. Craig
Publisher:
W. H. Freeman