Please answer the problem applying the steps in testing hypothesis

Glencoe Algebra 1, Student Edition, 9780079039897, 0079039898, 2018
18th Edition
ISBN:9780079039897
Author:Carter
Publisher:Carter
Chapter10: Statistics
Section10.3: Measures Of Spread
Problem 26PFA

Related questions
Question
100%
Please answer the problem applying the steps in testing hypothesis.

Transcribed Image Text:STEP 6:
Conclusion:
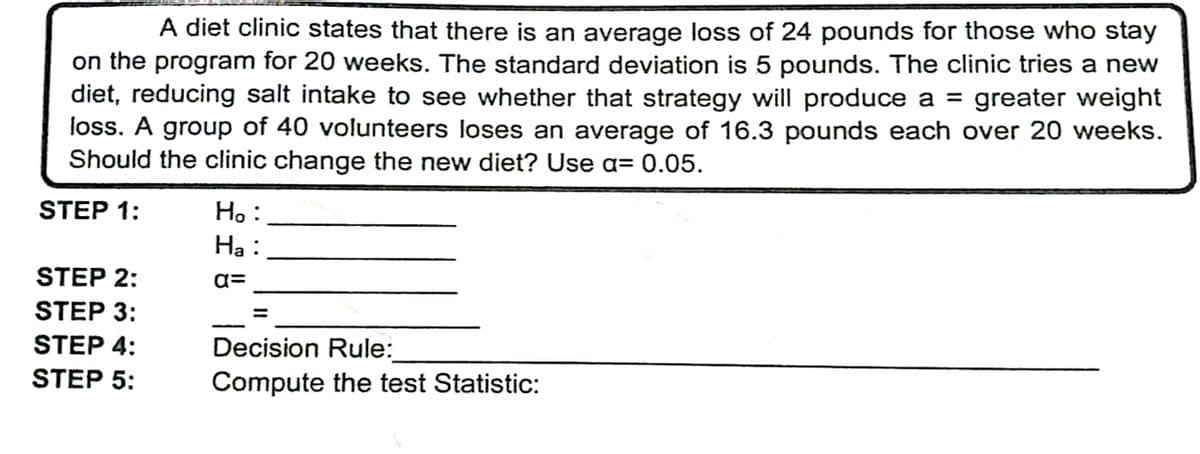
Transcribed Image Text:A diet clinic states that there is an average loss of 24 pounds for those who stay
on the program for 20 weeks. The standard deviation is 5 pounds. The clinic tries a new
diet, reducing salt intake to see whether that strategy will produce a = greater weight
loss. A group of 40 volunteers loses an average of 16.3 pounds each over 20 weeks.
Should the clinic change the new diet? Use a= 0.05.
STEP 1:
Ho:
Ha :
STEP 2:
a=
STEP 3:
STEP 4:
Decision Rule:
STEP 5:
Compute the test Statistic:
Expert Solution
This question has been solved!
Explore an expertly crafted, step-by-step solution for a thorough understanding of key concepts.

Step by step
Solved in 2 steps with 2 images

Recommended textbooks for you
Glencoe Algebra 1, Student Edition, 9780079039897…
Algebra
ISBN:
9780079039897
Author:
Carter
Publisher:
McGraw Hill
Glencoe Algebra 1, Student Edition, 9780079039897…
Algebra
ISBN:
9780079039897
Author:
Carter
Publisher:
McGraw Hill