Please complete the following exercises according to Areas under the normal curve table. In an IQ (Intelligence Quotient)distribution (which is a normal distribution)with mean of 100 and a standard deviation of 15, find the percentage of individuals who has and IQ of: a)More than 135(genius) b)Less than 90 c)Between 75 and 125
Please complete the following exercises according to Areas under the normal curve table. In an IQ (Intelligence Quotient)distribution (which is a normal distribution)with mean of 100 and a standard deviation of 15, find the percentage of individuals who has and IQ of: a)More than 135(genius) b)Less than 90 c)Between 75 and 125

Glencoe Algebra 1, Student Edition, 9780079039897, 0079039898, 2018
18th Edition
ISBN:9780079039897
Author:Carter
Publisher:Carter
Chapter10: Statistics
Section10.4: Distributions Of Data
Problem 19PFA

Related questions
Question
Please complete the following exercises according to Areas under the normal curve table.
In an IQ (Intelligence Quotient)distribution (which is a
a)More than 135(genius)
b)Less than 90
c)Between 75 and 125
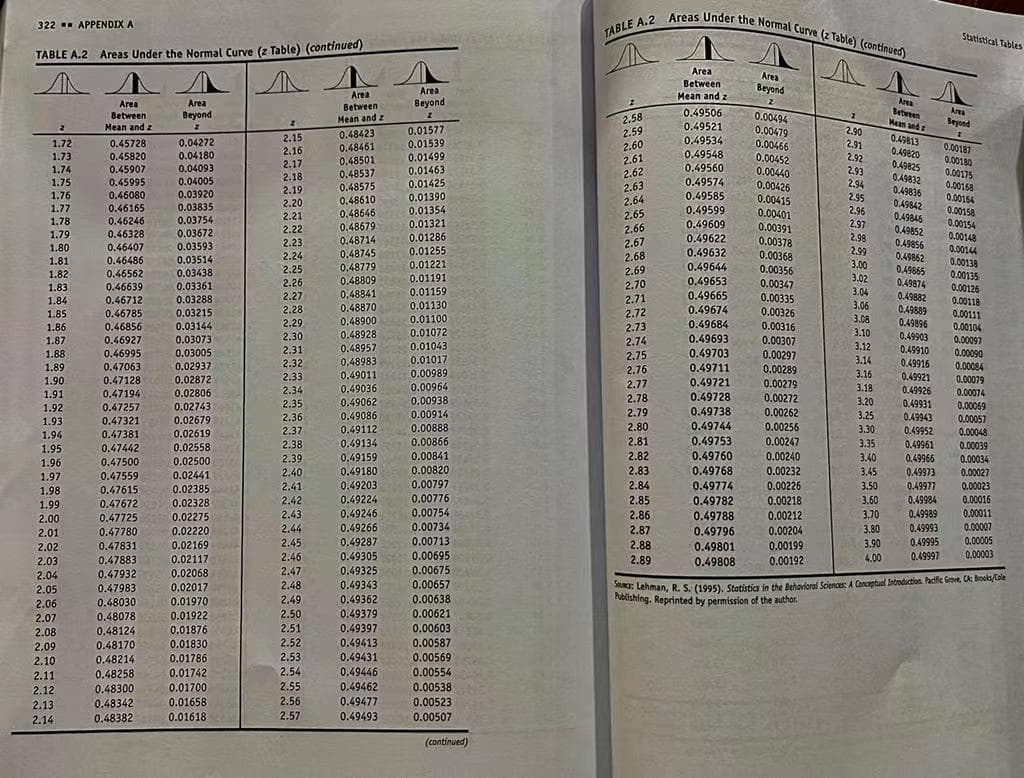
Transcribed Image Text:TABLE A.2 Areas Under the Normal Curve (2 Table) (continued)
322 APPENDIX A
Statistical Tables
TABLE A.2 Areas Under the Normal Curve (z Table) (continued)
Area
Between
Mean and z
Area
Beyond
Area
Area
Beyond
Area
Betreen
Mean and z
Area
Area
Between
Area
Beyond
Beyond
0.49506
0.00494
0.00479
0.00466
Between
2.58
2.59
Mean and z
Mean and z
0.49521
0.01577
2.90
0.48423
0.48461
0.48501
0.48537
0.48575
0.49813
0.49820
O.49825
0.49832
2.15
0.49534
0.04272
0.04180
0.04093
0.04005
1.72
0.45728
0.45820
0.45907
0.45995
0.01539
0.01499
0.01463
2.60
2.61
2.91
0.00187
0.00180
0.00175
0.00168
0.00164
0.00158
0.00154
0.00148
0.00144
0.00138
0.00135
0.00126
0.00118
1.73
2.16
0.49548
0.00452
0.00440
0.00426
0.00415
0.00401
0.00391
0.00378
0.00368
0.00356
2.92
2.17
0.49560
0.49574
1.74
2.62
2.63
2.64
2.65
2.66
2.67
2.93
2.18
1.75
1.76
0.01425
0.01390
0.01354
2.94
2.95
2.96
2.97
2.98
0.49836
0.49842
2.19
0.46080
0.03920
0.49585
2.20
0.48610
1.77
0.46165
0.03835
0.49599
0.48646
0.49846
0.49852
0.49856
0.49862
2.21
0.03754
1.78
1.79
1.80
0.46246
0.01321
0.01286
0.01255
0.01221
0.49609
0.48679
0.48714
2.22
0.46328
0.46407
0.46486
0.03672
0.03593
0.49622
0.49632
2.23
2.24
2.25
2.26
0.48745
0.48779
2.68
2.69
2.70
2.71
2.72
2.99
3.00
1.81
0.03514
0.49644
0.46562
0.46639
0.03438
0.03361
0.03288
0.49665
0.49874
1.82
3.02
3.04
0.01191
0.48809
0.48841
0.49653
0.00347
1.83
1.84
0.01159
0.49665
0.49882
0.49889
0.49896
0.49903
0.49910
0.49916
0.49921
2.27
0.00335
0.00326
0.46712
0.48870
0.48900
0.48928
3.06
3.08
0.01130
2.28
0.49674
1.85
1.86
1.87
0.46785
0.03215
0.01100
0.01072
0.00111
0.00104
2.29
0.03144
0.03073
0.03005
0.49684
0.00316
0.00307
0.46856
2.73
2.30
3.10
0.49693
0.49703
0.00097
0.00090
0.00084
0.00079
0.00074
0.00069
0.46927
2.74
0.01043
0.01017
0.00989
2.31
0.48957
3.12
1.88
0.46995
2.75
0.00297
0.48983
0.49011
0.49036.
3.14
3.16
2.32
0.02937
0.02872
1.89
0.47063
2.76
2.77
0.49711
0.00289
0.00279
0.00272
0.47128
2.33
0.49721
0.49728
1.90
0.00964
0.00938
0.00914
0.00888
3.18
2.34
2.35
0.49926
0.49931
1.91
0.47194
0.02806
0.49062
2.78
3.20
1.92
0.47257
0.02743
0.49086
2.79
0.49738
0.00262
3.25
0.49943
0.49952
2.36
0.00057
0.47321
0.47381
1.93
0.02679
2.37
0.49112
2.80
0.49744
0.00256
3.30
0.00048
0.00039
1.94
0.02619
0.49753
0.00247
0.49134
0.49159
0.49180
1.95
0.47442
0.02558
2.38
0.00866
2.81
3.35
0.49961
0.00841
2.82
0.49760
0.49768
0.49774
0.49782
0.49788
1.96
0.47500
0.02500
2.39
0.00240
3.40
0.49966
0.00034
2.40
0.00820
2.83
0.00232
3.45
0.49973
0.00027
0.02441
0.02385
1.97
0.47559
2.41
0.49203
0.00797
2.84
0.00226
3.50
0.49977
0.47615
0.47672
0.00023
0.00016
1.98
0.00776
0.00754
0.00734
0.00218
0.00212
0.49224
2.85
2.86
2.87
2.88
2.89
1.99
0.02328
2.42
3.60
0.49984
0.49246
0.49266
0.49287
0.49989
0.49993
0.49995
0.49997
2.43
3.70
0.00011
0.47725
0.47780
0.47831
0.47883
2.00
0.02275
0.00007
0.00005
2.44
0.00204
0.00199
3.80
3.90
2.01
0.02220
0.49796
2.02
0.02169
2.45
0.00713
0.49801
2.46
0.49305
0.00695
4.00
0.00003
2.03
0.02117
0.49808
0.00192
2.04
0.47932
0.02068
2.47
0.49325
0.00675
tehman, R. S. (1995). Stotistica in the Behavioral Sciences: A Conceptual Irtroduction. Pacific Grove, CA: Brooks/Cole
habishing. Reprinted by permission of the author.
2.48
0.49343
0.00657
0.47983
0.48030
0.48078
0.48124
0.48170
2.05
0.02017
2.06
0.01970
2.49
0.49362
0.00638
0.49379
0.49397
0.49413
0.49431
0.49446
0.49462
0.00621
0.01922
0.01876
0.01830
0.01786
2.50
2.07
0.00603
0.00587
0.00569
0.00554
0.00538
0.00523
2.08
2.51
2.09
2.52
2.10
0.48214
2.53
2.11
0.48258
0.01742
2.54
0.01700
0.01658
2.12
0.48300
2.55
2.56
0.49477
2.13
2.14
0.48342
0.48382
0.01618
2.57
0.49493
0.00507
(continued)
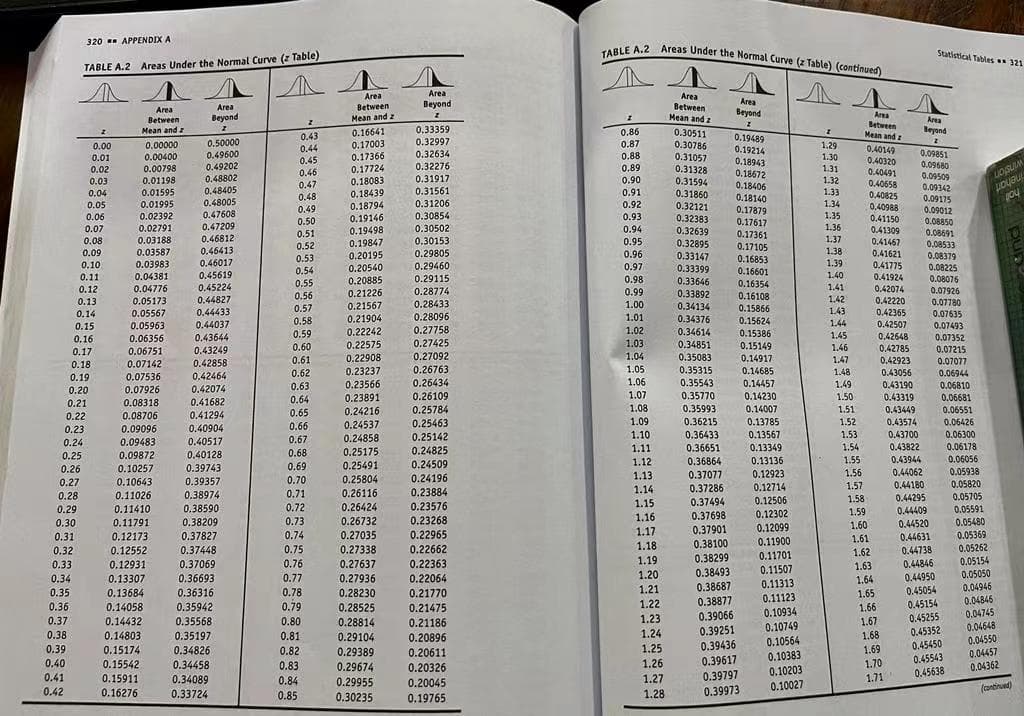
Transcribed Image Text:TABLE A.2 Areas Under the Normal Curve (z Table) (continued)
320 APPENDIX A
aLE A.2 Areas Under the Normal Curve (z Table) (continued)
Statistical Tables 321
TABLE A.2 Areas Under the Normal Curve (z Table)
Area
Area
Between
Area
Between
Mean and z
Area
Beyond
Beyond
Area
Area
Area
Between
Mean and
Beyond
Mean and z
Area
leyond
Between
Mean and z
0.33359
0.16641
0.17003
0.17366
0.86
0.30511
0.30786
0.43
0.19489
0.19214
0.18943
0.18672
0.18406
0.18140
0.17879
0.17617
0.17361
0.17105
0.16853
0.16601
0.50000
0.00000
0.00400
0.00798
0.01198
0.01595
0.32997
0.32634
0.32276
0.87
0.88
0.00
1.29
0.44
0.45
0.40149
0.09851
0.09680
0.09509
0.09342
0.09175
0.09012
0.08850
0.08691
0.08533
0.08379
0.08225
0.08076
0.07926
0.07780
0.07635
0.49500
0.31057
0.31328
0.31594
0.01
1.30
0.40320
0.49202
0.48802
0.48405
0.48005
0.47608
0.17724
0.18083
0.18439
0.18794
0.19146
0.19498
0.19847
0.02
0.89
1.31
0.40491
0.46
0.47
0.48
0.49
0.50
0.31917
0.31561
0.90
0.91
0.03
1.32
inehart
0.40658
0.40825
0,40988
0.41150
1.33
0.31860
0.32121
0.32383
0.04
0.05
0.01995
0.31206
0.92
1.34
0.02392
0.02791
0.30854
0.30502
0.06
1.35
0.47209
0.46812
0.93
0.94
1.36
1.37
1.38
1.39
0.07
0.41309
0.03188
0.03587
0.03983
0.04381
0.51
0.52
0.53
0.32639
0.32895
0.33147
0.33399
0.08
0.30153
0.29805
0.95
0.96
0.46413
0.46017
0.45619
0.45224
0.44827
0.44433
0.41467
0.41621
0.41775
0.41924
0.42074
0.09
0.20195
0.20540
0.20885
0.21226
0.10
0.11
0.29460
0.97
0.54
0.55
0.56
0.29115
0.98
0.33646
1.40
0.16354
0.04776
0.05173
0.12
0.28774
0.99
1.41
0.33892
0.34134
0.34376
0.16108
0.15866
1.42
1.43
1.44
0.13
0.28433
0.42220
0.21567
0.21904
0.22242
1.00
0.57
0.42365
0.42507
0.14
0.05567
0.28096
1.01
0.58
0.15624
0.15386
0.05963
0.06356
0.06751
0.44037
0.43644
0.43249
0.15
0.07493
0.59
0.27758
1.02
0.34614
0.16
1.45
0.42648
0.07352
0.22575
0.22908
0.23237
0.23566
0.23891
0.60
0.27425
1.03
0.34851
0.15149
1.46
0.42785
0.42923
0.17
0.07215
0.61
0.27092
1.04
0.35083
0.14917
1.47
0.07142
0.42858
0.07077
0.18
0.19
0.26763
1.05
0.35315
0.35543
0.14685
0.14457
0.62
0.63
0.64
0.65
1.48
0.43056
0.43190
0.43319
0.07536
0.42464
0.06944
0.26434
1.06
1.49
0.06810
0.20
0.07926
0.42074
0.26109
1.07
0.35770
0.14230
0.14007
0.13785
0.13567
0.13349
1.50
0.06681
0.06551
0.06426
0.06300
0.21
0.08318
0.41682
1.08
0.35993
0.24216
0.24537
0.25784
1.51
0.43449
0.22
0.08706
0.41294
0.25463
0.25142
0.36215
0.36433
1.09
1.52
0.43574
0.43700
0.43822
0.43944
0.44062
0.23
0.09096
0.40904
0.66
1.10
1.53
0.24858
0.25175
0.25491
0.09483
0.67
0.40517
0.40128
0.24
0.36651
0.36864
0.37077
0.37286
1.54
0.06178
0.06056
0.05938
0.68
0.24825
1.11
0.25
0.09872
0.24509
1.12
0.13136
1.55
0.39743
0.39357
0.26
0.10257
0.69
1.13
0.12923
1.56
0.70
0.25804
0.24196
0.10643
0.11026
0.11410
0.27
0.05820
0.12714
0.12506
0.12302
1.57
0.44180
0.38974
0.71
0.26116
0.23884
1.14
0.28
0.05705
0.44295
0.44409
0.44520
1.58
0.38590
0.72
0.26424
0.23576
1.15
0.37494
0.29
1.59
0.05591
0.37698
0.37901
0.38100
0.38299
0.38493
0.38687
0.38877
0.39066
0.39251
0.39436
0.39617
0.39797
0.30
0.11791
0.38209
0.73
0.26732
0.23268
1.16
0.05480
1.60
0.12099
0.11900
0.27035
0.27338
0.27637
0.27936
0.28230
0.28525
1.17
1.18
1.19
1.20
1.21
0.05369
0.05262
0.05154
0.05050
0.04946
0.31
0.12173
0.37827
0.74
0.22965
1.61
0.44631
0.32
0.12552
0.37448
0.75
0.22662
1.62
0.44738
0.11701
0.22363
0.22064
0.21770
0.44846
0.44950
0.45054
0.33
0.12931
0.37069
0.76
1.63
1.64
0.11507
0.11313
0.11123
0.10934
0.10749
0.10564
0.10383
0.10203
0.10027
0.34
0.13307
0.36693
0.77
0.35
0.13684
0.36316
0.78
1.65
0.04845
0.04745
0.04648
0.04550
0.04457
0.04362
0.36
0.14058
0.35942
0.79
0.21475
1.22
1.66
0.45154
0.45255
0.45352
0.45450
0.45543
0.45638
0.37
0.14432
0.35568
0.80
0.28814
0.21186
1.23
1.67
1.24
1.25
1.26
0.38
0.14803
0.35197
0.81
1.68
0.20896
0.20611
0.29104
0.39
0.15174
0.34826
0.82
1.69
0.29389
0.29674
0.29955
0.30235
0.40
0.15542
0.34458
0.83
0.20326
1.70
0.41
0.15911
0.16276
0.34089
0.84
0.20045
1.27
1.71
0.42
0.39973
(contirued)
0.33724
0.85
0.19765
1.28
Expert Solution
This question has been solved!
Explore an expertly crafted, step-by-step solution for a thorough understanding of key concepts.

Step by step
Solved in 3 steps with 2 images

Recommended textbooks for you
Glencoe Algebra 1, Student Edition, 9780079039897…
Algebra
ISBN:
9780079039897
Author:
Carter
Publisher:
McGraw Hill
Glencoe Algebra 1, Student Edition, 9780079039897…
Algebra
ISBN:
9780079039897
Author:
Carter
Publisher:
McGraw Hill