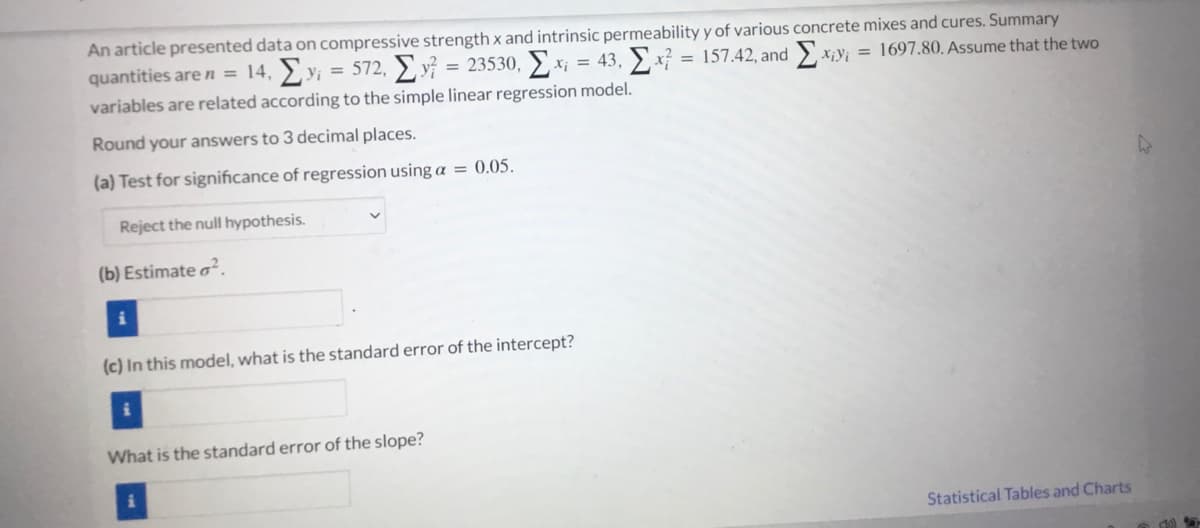
Please find the standard error of the intercept Please find the standard error of the slope ASAP


Q: All of the below sets have the same mean. Set 1-Standard Deviation=3.1 Set 2-Standard…
A:
Q: Let X1,.. X, is a random sample from Binomial(p) and Y,. Ym is another independent random sample…
A:
Q: The more appropriate measure of center to use for a data set that is severely skewed is A.…
A: We have given the following statement about the center data.
Q: Suppose that each of n jurors independently has a 0.7 probability of deciding correctly whether an…
A: GivenThe number of jurors =nthe probability that each juror decide correctly if an accused person is…
Q: Which can be used for hypothesis testing for matched data pairs? OT test O Sign test O Signed-rank…
A: For the given data Select the correct choice
Q: Ms. R is a Grade 11 teacher. She conducted an examination before and after she discussed Linear…
A: For the given data Find r = ? Interpret the value of r
Q: Ervin determined the amount of CaCO3 (as ppm) in their municipality water. Based on his results are…
A: The given data set is, 155, 165, 138, 172, 127, 193, 142 The value of sample mean is,
Q: 2. Let X denote the amount in pesos a vendor eams during a particular hour of the day. Suppose the…
A: Given that, X denote the amount in pesos a vendor eams during a particular hour of the day. The PMF…
Q: 3. Identifying individuals with a high risk of Alzheimer's disease usually involves a long series of…
A: As per the Bartleby guildlines we have to solve first three subparts and rest can be reposted.....…
Q: A data set includes the counts of chocolate chips from three different types of Chips Ahoy cookies.…
A: There are 3 independent samples which follows normal distribution. We have to test whether the three…
Q: In a survey of 2591 adults in a recent year, 1302 say they have made a New Year's resolution.…
A: It is given that sample size (n) is 2591 and x=1302.
Q: QUESTION 26 Use the information stated below to answer the question stated below. Information #2 If…
A: The concept of standard normal distribution is crucial to statistical analysis.
Q: TV advertising agencies face increasing challenges in reaching audience members because viewing TV…
A:
Q: 5. Let X have a uniform distribution on the interval (0,2). Given X = x, let Y have a (conditional)…
A:
Q: use the frequency distribution to complete parts (d) through (e). a) Determine the total number…
A: The question is based on a frequency distribution Given :
Q: Which class had the higher minimum? 68 69 70 71 72 73 74 75 76 77 78 79 80 81 82 83 84 85 86 87 88…
A: Given that ; A box plot is given for two classes firstly find out the five number summary of both…
Q: STEP 4: Calculating F value. Calculate the following Ex² = %3D SSB = SSW = Therefore, MSB = MSW %D…
A: Given that, the Land Transportation and Franchising Regulatory Board (LTFRB) wants to examine the…
Q: Find the mode of the following number of stingrays spotted by each person during a snorkeling trip.…
A: Given data values: 11,5,7,5,11,1,7,4,1,7,7 The value 11 is repeated 2 times. The value 5 is repeated…
Q: Find the value of t using Table V, Appendix A. Use three decimal places in your final answer.…
A: Given:
Q: 2. A random sample of 25 jars of instant coffee has a mean weight of 195.75 grams with a standard…
A: The random variable weight follows normal distribution. We have to test whether the mean weight is…
Q: 1. What is the probability of meeting a student who is full-time or a finance major? 2. Is this an…
A: The Business club at a local club is composed of 20 part-time accounting majors, 15 part-time…
Q: A hog raiser in a certain province uses two methods of pig-farming: intensive pig farming, where…
A: 1. The appropriate null and alternative hypotheses are :
Q: A researcher wishes to see of the way people to obtain information is independent of their…
A: tep 1: Null Hypothesis: H0: The way people is independent of their educational background.…
Q: Perform correlation analysis. How strong is the linear relationship between Y and X?
A: Given information: y x x^2 y^2 xy 73 100 10000 5329 7300 68 118 13924 4624 8024 91 141…
Q: Which of the following variables can we treat as both categorical and continuous, depending on how…
A:
Q: 18. Suppose a researcher conducts a study on the relationship between hours of exercise per week and…
A:
Q: A continuous random variable X has a PDF f(x)= 3x²,0 a} and (ii) P{X >h} =0 05
A: Given information: fx=3x2, 0<x<1 i) PX=a=PX>a 0=∫a13x2dx since, the…
Q: Consider two sampling designs, drawn from the same population of N = 1,800,000 %3D elements. Design…
A: Solution: As per the guidelines only first three sub parts should be answered. If the remaining…
Q: We want to estimate the mean distance travelled to work by employees of a large manufacturing firm.…
A: Given,standard deviation(σ)=2margin of error(E)=0.1α=1-0.95=0.05α2=0.025Z0.025=1.96 (from Z-table)
Q: -generating function is as follows f(x)= 2x-1/16 , x=1,2,3,4 my answer is mean = 25/8, var = 170/16…
A: x 1 2 3 4 f(x) = 2x-116
Q: Annie is concerned over a report that "a woman over age 40 has a better chance of being killed by a…
A: Consider that p is the true population proportion of women over age 40, who are getting married.
Q: The 5 summary statistics for the homework and final scores of 100 randomly selected students from a…
A: “Since you have posted a question with multiple sub-parts, we will solve the first three sub-parts…
Q: The average score of all golfers for a particular course has a mean of 72 and a standard deviation…
A:
Q: The candy company that makes M&M's claims that 10% of the M&M's it produces is green. Suppose that…
A:
Q: If a mass function is given by Ax x = 1, 2 ..., 50 P(x) A(100– x), x = 51, 52.., 100 otherwise (i)…
A:
Q: Let X1,..., X is a random sample from Binomial(p) and Y..., Ym is another independent random sample…
A:
Q: Show complete solution 1. A random sample of 60 grade 11 students of RDG University showed a mean…
A: T tbatle is used for calculating t value.
Q: Salaries of Government Employees The mean salary of federal government employees on the General…
A: GivenMean(x)=59500standard deviation(σ)=1500sample size(n)=40significance level(α)=0.10
Q: 80 110 60
A: The summary of the total number of senior high school students enrolled in each school can be given.
Q: A psychiatrist is interested in finding a 90% confidence interval for the tics per hour exhibited by…
A: A psychiatrist is interested in finding a 90% confidence interval for the tics per hour exhibited by…
Q: Compute the following averages: b. During the past week, the following number of cases of measles…
A:
Q: The following is a list of 11 measurements. 9, 54,-46, 96,-31,-72,-96, 43, 5, 4,-93 Send data to…
A: We have given that, The data set of 11 measurements are : X :- 9, 54, -46, 96, -31, -72, -96, 43,…
Q: packs per hour. Does this indicate that the new employee's output is significantly different from…
A:
Q: 3. The frequency distribution of a measurable characteristic varying between 0 and 2 is represented…
A:
Q: Purchased Gum Kept the Money 16 Students Given Four Quarters 34 Students Given a $1 Bill 15 31 Find…
A: From the above-given information, it can be seen that the, total number of students = 34 + 15 + 16 +…
Q: If the probability density of a random variable is given by for 0<x<1 f(x) = { (2-x) for 1<x<2 find…
A:
Q: 19. In general, the larger the sample, the greater the sampling error. A. True B. False
A: We have given that, In general, the larger the sample, the greater the sampling error ? Then, We…
Q: Suppose that there are 30 school districts in a province with each district having 10 elementary…
A: Note: As per guidelines we will solve the first question only, please repost other questions for…
Q: (c) different mean porosity values. Support your conclusions about each comparison. If post-hoc…
A: H0: There is no difference in porosity across the three rock types.Ha: At least porosity for one…
Q: Show complete solution 2. Professor XY conducted a periodic examination to all her students enrolled…
A:

Step by step
Solved in 2 steps

- If your graphing calculator is capable of computing a least-squares sinusoidal regression model, use it to find a second model for the data. Graph this new equation along with your first model. How do they compare?A local University conducted a survey of over 2,000 MBA alumni to explore the issue of work-life balance. Each participant received a score ranging from 0 to 100, with lower scores indicating a higher imbalance between work and life. A sample of the data is available below. Let x=average number of hours worked per week and y=work-life balance scale score for each MBA alumnus. Investigate the link between these two variables by conducting a complete simple linear regression analysis of the data. Summarize your findings. Hours WLB Score 50 73.22 45 70.79 50 48.78 55 44.15 55 69.89 60 53.15 50 56.04 60 22.53 50 60.73 55 69.89 70 29.17 45 70.79 40 33.38 40 32.13 45 46.17 The least squares regression equation is y=enter your response here+enter your…A local University conducted a survey of over 2,000 MBA alumni to explore the issue of work-life balance. Each participant received a score ranging from 0 to 100, with lower scores indicating a higher imbalance between work and life. A sample of the data is available below. Let x=average number of hours worked per week and y=work-life balance scale score for each MBA alumnus. Investigate the link between these two variables by conducting a complete simple linear regression analysis of the data. Summarize your findings. Hours WLB Score 50 73.22 45 70.79 50 48.78 55 44.15 55 69.89 60 53.15 50 56.04 60 22.53 50 60.73 55 69.89 70 29.17 45 70.79 40 33.38 40 32.13 45 46.17 Check the usefulness of the hypothesized model. What are the hypotheses to test?…
- A local University conducted a survey of over 2,000 MBA alumni to explore the issue of work-life balance. Each participant received a score ranging from 0 to 100, with lower scores indicating a higher imbalance between work and life. A sample of the data is available below. Let x=average number of hours worked per week and y= work-life balance scale score for each MBA alumnus. Investigate the link between these two variables by conducting a complete simple linear regression analysis of the data. Summarize your findings. Hours WLB Score 50 74.09 45 72.45 50 52.93 55 44.33 50 69.15 60 54.79 55 56.26 60 20.44 55 6-.64 50 69.15 70 29.16 45 72.45 40 33.25 40 32.18 45 45.76 a. What is the test statistic for the hypotheses? t=______ b. What is the p-value for the test statistic? p-value=________ c. What is the value for the coeffiecent of determination r^2? r^2=________A scientific foundation wanted to evaluate the relation between y= salary of researcher (in thousands of dollars), x1= number of years of experience, x2= an index of publication quality, x3=sex (M=1, F=0) and x4= an index of success in obtaining grant support. A sample of 35 randomly selected researchers was used to fit the multiple regression model. Parts of the computer output appear below. Based from the table, what is the constant term of the multiple linear regression?A researcher examined the relationship between the annual tax amount paid by the construction company owners and the total expense items spent for the construction with regression analysis and calculated the regression line estimation as Y=6+2X. According to this; Write the interpretations of the cutoff and regression parameters, respectively, in your OWN SENTENCES in a statistically appropriate way over the tax amount and expenses.
- no in Excel It is required to use the data given in the table to estimate the parameters of the simple linear regression equation by any of the estimation methods:When is the standard error of the estimate (in linear regression) large? When the X values are very close to the Y values. When the residuals are large on average. When the average distance between actual Y scores and predicted Y scores is small. When the coefficient of determination is small.You will not obtain a high R-squared value in a multiple regression if all the partial slopecoefficients are individually statistically insignificant on the basis of the usual t test. State the reason. why?
- In an attempt to develop a model of wine quality as judged by wine experts, data was collected from 50 red wine variants of a certain type of wine. A multiple linear regression model to predict wine quality, measured on a scale from 0 (very bad) to 10 (excellent) was developed, based on alcohol content (%), X1, and the amount of chlorides, X2. Perform a multiple regression analysis and determine the VIF for each independent variable in the model. Is there reason to suspect the existence of collinearity? Determine the VIF for each independent variable in the model, with VIF1 and VIF2 being the VIF for X1 and X2, respectively.Find regression of line scatterpolot ? identify chararctrics of the data that is ignored by regression LineWrite down the econometric model that this OLS regression estimates. Interpret the educ coefficient. At how many average weekly hours worked is the marginal effect of hours on predicted wage equal to zero? What is the exact effect (in percent) of an increase of 10 years of education on predicted wage? What is the predicted monthly wage in US$ for a worker with 10 years of education, an IQ score of 100, who works on average 40 hours per week?