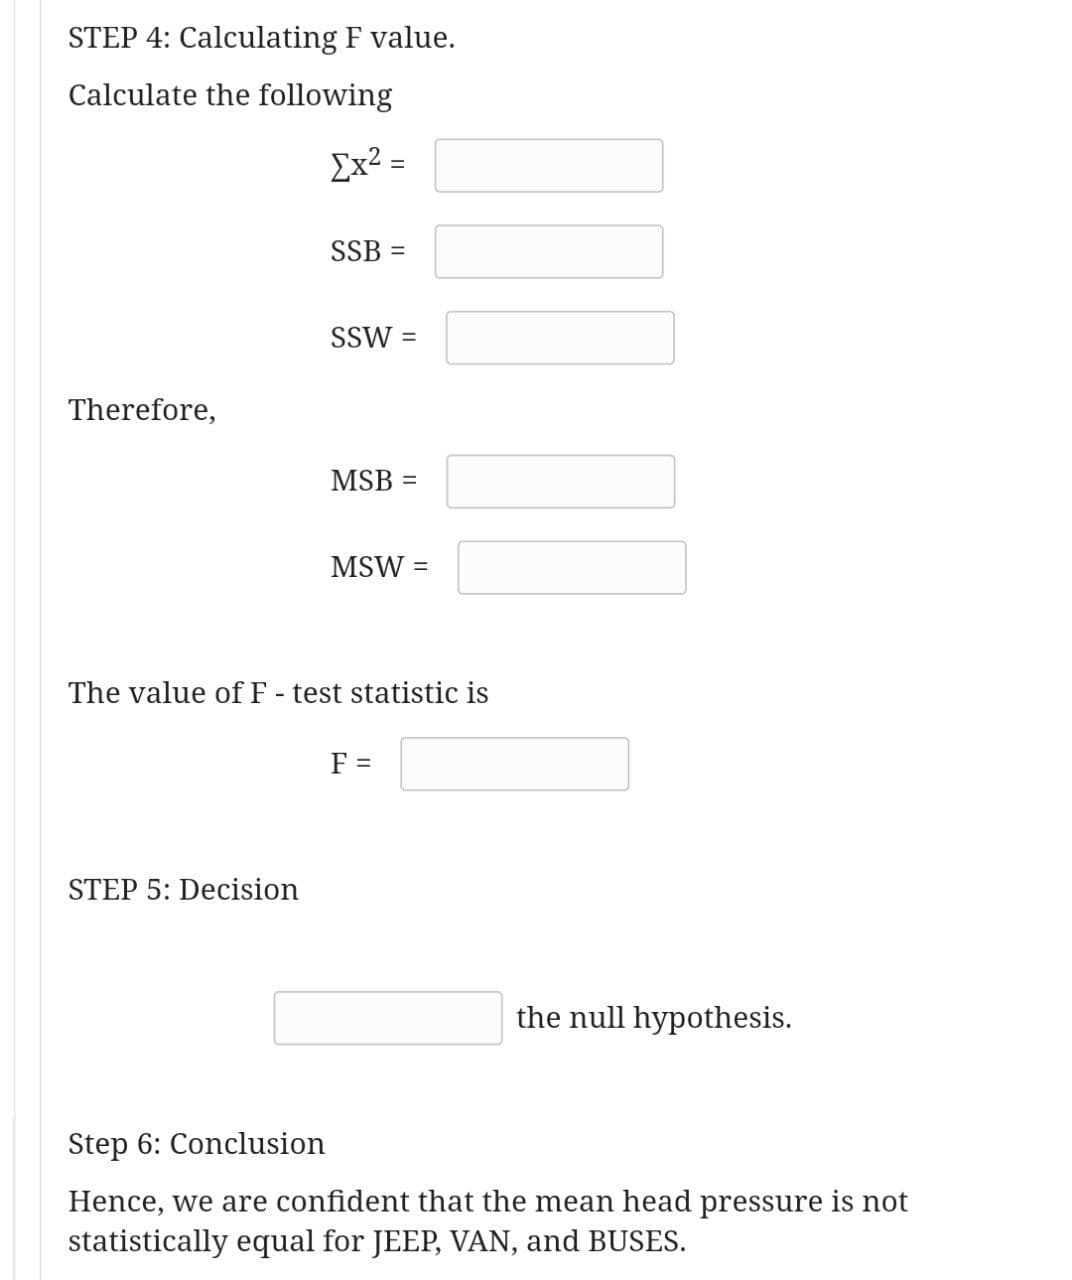
STEP 4: Calculating F value. Calculate the following Ex² = %3D SSB = SSW = Therefore, MSB = MSW %D The value of F - test statistic is F = STEP 5: Decision the null hypothesis. Step 6: Conclusion Hence, we are confident that the mean head pressure is not statistically equal for JEEP, VAN, and BUSES.
STEP 4: Calculating F value. Calculate the following Ex² = %3D SSB = SSW = Therefore, MSB = MSW %D The value of F - test statistic is F = STEP 5: Decision the null hypothesis. Step 6: Conclusion Hence, we are confident that the mean head pressure is not statistically equal for JEEP, VAN, and BUSES.
Glencoe Algebra 1, Student Edition, 9780079039897, 0079039898, 2018
18th Edition
ISBN:9780079039897
Author:Carter
Publisher:Carter
Chapter10: Statistics
Section10.4: Distributions Of Data
Problem 19PFA
Related questions
Question

Transcribed Image Text:STEP 4: Calculating F value.
Calculate the following
Ex² =
SSB =
SSW =
Therefore,
MSB =
MSW =
The value of F - test statistic is
F =
STEP 5: Decision
the null hypothesis.
Step 6: Conclusion
Hence, we are confident that the mean head pressure is not
statistically equal for JEEP, VAN, and BUSES.

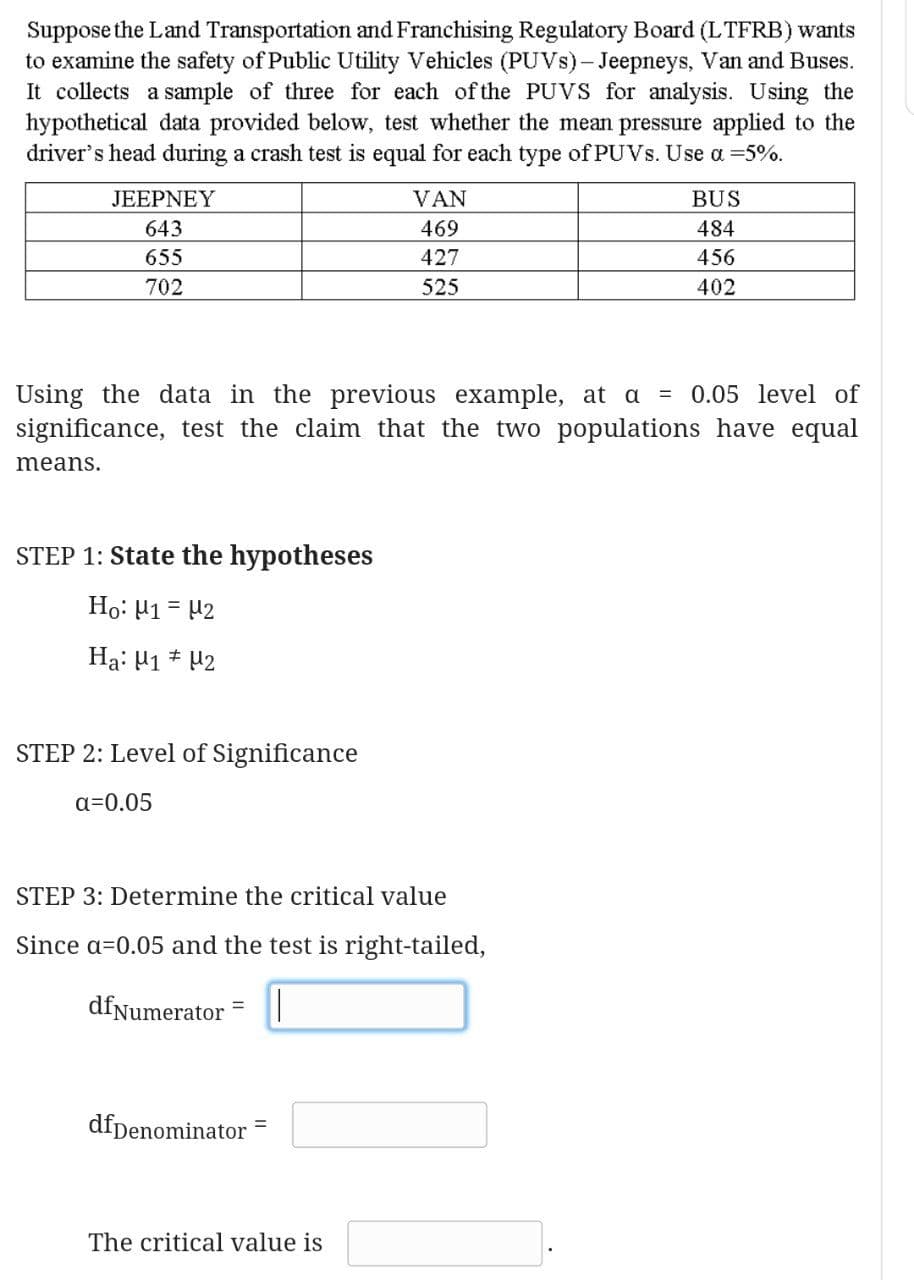
Transcribed Image Text:Suppose the Land Transportation and Franchising Regulatory Board (LTFRB) wants
to examine the safety of Public Utility Vehicles (PUVS)- Jeepneys, Van and Buses.
It collects a sample of three for each of the PUVS for analysis. Using the
hypothetical data provided below, test whether the mean pressure applied to the
driver's head during a crash test is equal for each type of PUVS. Use a =5%.
JEEPNEY
VAN
BUS
643
469
484
655
427
456
702
525
402
Using the data in the previous example, at a = 0.05 level of
significance, test the claim that the two populations have equal
means.
STEP 1: State the hypotheses
Ho: 41 = 42
Ha: H1 * 42
STEP 2: Level of Significance
a=0.05
STEP 3: Determine the critical value
Since a=0.05 and the test is right-tailed,
dfNumerator
%3D
dfpenominator =
The critical value is
Expert Solution
This question has been solved!
Explore an expertly crafted, step-by-step solution for a thorough understanding of key concepts.
Step by step
Solved in 2 steps with 2 images

Recommended textbooks for you

Glencoe Algebra 1, Student Edition, 9780079039897…
Algebra
ISBN:
9780079039897
Author:
Carter
Publisher:
McGraw Hill

Glencoe Algebra 1, Student Edition, 9780079039897…
Algebra
ISBN:
9780079039897
Author:
Carter
Publisher:
McGraw Hill