Please help me with this question. More than one answer may be correct. THe graph relating to the information is included below. Hydrothermal vents are ocean floor habitats where geothermal super-heated seawater (sometimes greater than 400 degrees C) gushes from the ocean floor. Near these hydrothermal vents are rich ecosystems of organisms that have been adapted to the dynamic temperatures of these environments. The graph above shows the results of an experiment in which two hydrothermal vent associated worms were exposed to elevated temperatures. The P12->38 (darker grey bars) represents the species Paralvinella palmiformis (palm worms for short), which was raised from a temperature of 12C to a temperature of 38C. The S10->45 (lighter grey bars) represents the species Paralvinella sulfincola (sulfide worms for short), which was raised from a temperature of 10C to a temperature of 45C. After each species raised in temperature, tissues were extracted and the expression of several proteins were measured (shown along the x-axis). The y-axis shows the log10 fold change (0= no change, 1 = ten fold increase, -1 = ten fold decrease) in expression of each protein from control animals not exposed to the elevated temperatures. From the above figure, you can conclude what about the relative thermotolerance of Paralvinella palmiformis and Paralvinella sulfincola Options: P. sulfincola likely has more mis-folded proteins from the thermal stress than P. palmiformis P. palmiformis likely has more mis-folded proteins from the thermal stress than P. sulfincola P. palmiformis likely lives in hotter environments than p. sulfincola P. palmiformis is more thermotolerant than P. sulfincola P. sulfincola is more thermotolerant than P. palmiformis


Please help me with this question. More than one answer may be correct. THe graph relating to the information is included below.
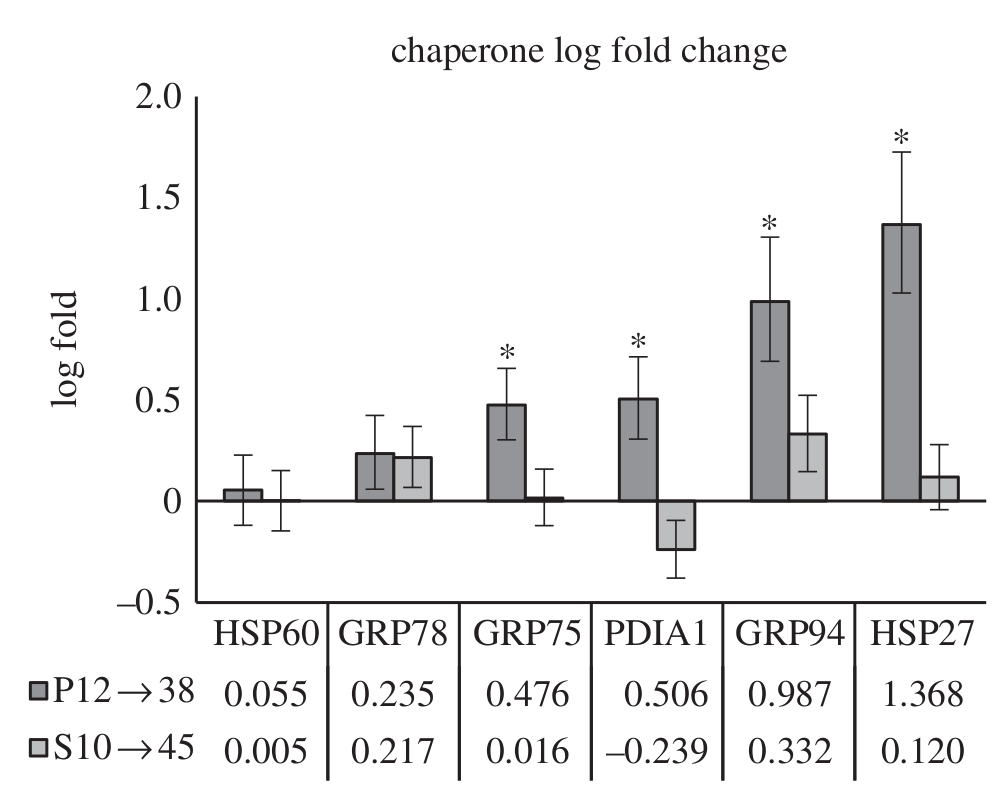
Hydrothermal vents are ocean floor habitats where geothermal super-heated seawater (sometimes greater than 400 degrees C) gushes from the ocean floor. Near these hydrothermal vents are rich ecosystems of organisms that have been adapted to the dynamic temperatures of these environments. The graph above shows the results of an experiment in which two hydrothermal vent associated worms were exposed to elevated temperatures. The P12->38 (darker grey bars) represents the species Paralvinella palmiformis (palm worms for short), which was raised from a temperature of 12C to a temperature of 38C. The S10->45 (lighter grey bars) represents the species Paralvinella sulfincola (sulfide worms for short), which was raised from a temperature of 10C to a temperature of 45C. After each species raised in temperature, tissues were extracted and the expression of several proteins were measured (shown along the x-axis). The y-axis shows the log10 fold change (0= no change, 1 = ten fold increase, -1 = ten fold decrease) in expression of each protein from control animals not exposed to the elevated temperatures. From the above figure, you can conclude what about the relative thermotolerance of Paralvinella palmiformis and Paralvinella sulfincola
Options:
P. sulfincola likely has more mis-folded proteins from the thermal stress than P. palmiformis
P. palmiformis likely has more mis-folded proteins from the thermal stress than P. sulfincola
P. palmiformis likely lives in hotter environments than p. sulfincola
P. palmiformis is more thermotolerant than P. sulfincola
P. sulfincola is more thermotolerant than P. palmiformis

Step by step
Solved in 3 steps


