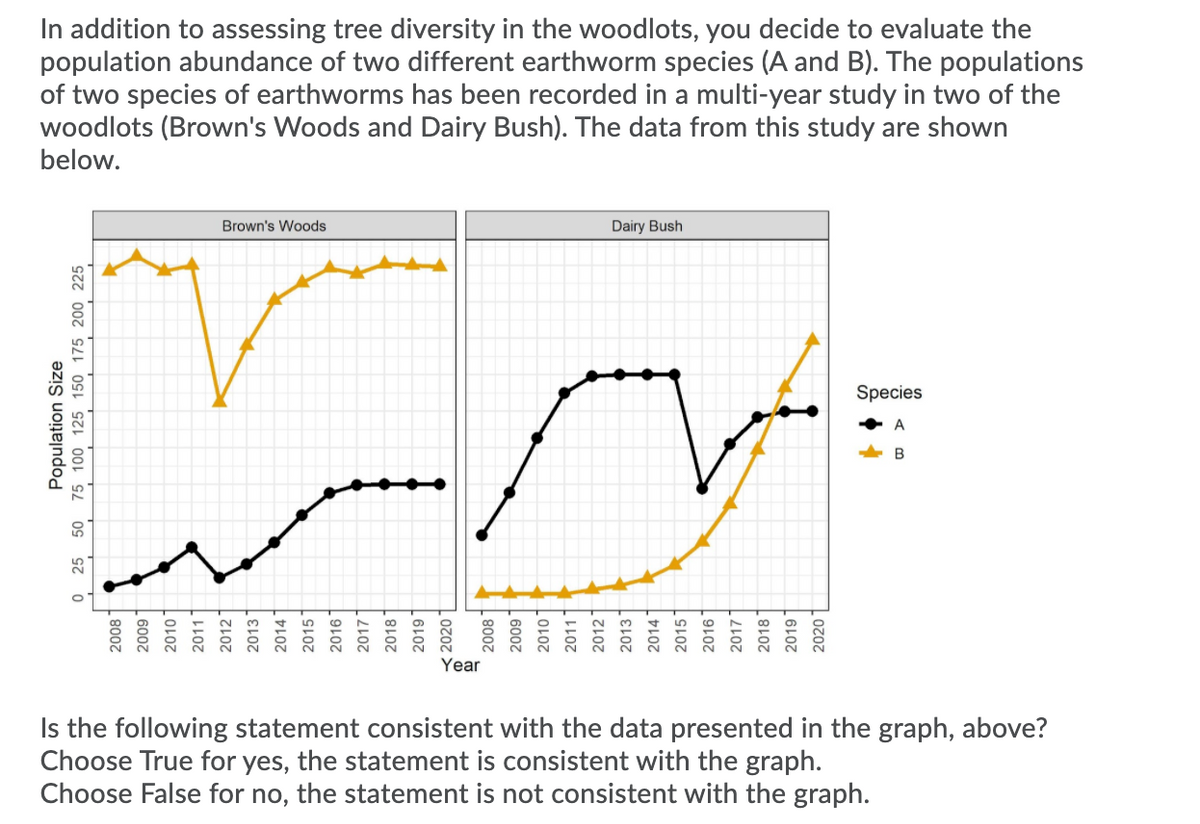
In addition to assessing tree diversity in the woodlots, you decide to evaluate the population abundance of two different earthworm species (A and B). The populations of two species of earthworms has been recorded in a multi-year study in two of the woodlots (Brown's Woods and Dairy Bush). The data from this study are shown below. Brown's Woods Dairy Bush Species A B Year Is the following statement consistent with the data presented in the graph, above? Choose True for yes, the statement is consistent with the graph. Choose False for no, the statement is not consistent with the graph. Population Size O 25 50 75 100 125 150 175 200 225 2008 2009 * 2010 2011 2012 2013* 2014 2015 2016 2017 2018* 2019 2008 * 600Z 2010 2011 2012 2013 2014 2015 2016 ° 2017 2018 2019 2020
In addition to assessing tree diversity in the woodlots, you decide to evaluate the population abundance of two different earthworm species (A and B). The populations of two species of earthworms has been recorded in a multi-year study in two of the woodlots (Brown's Woods and Dairy Bush). The data from this study are shown below. Brown's Woods Dairy Bush Species A B Year Is the following statement consistent with the data presented in the graph, above? Choose True for yes, the statement is consistent with the graph. Choose False for no, the statement is not consistent with the graph. Population Size O 25 50 75 100 125 150 175 200 225 2008 2009 * 2010 2011 2012 2013* 2014 2015 2016 2017 2018* 2019 2008 * 600Z 2010 2011 2012 2013 2014 2015 2016 ° 2017 2018 2019 2020

Science Of Agriculture Biological Approach
5th Edition
ISBN:9780357229323
Author:Herren
Publisher:Herren
Chapter19: Wildlife Management
Section: Chapter Questions
Problem 2SLA

Related questions

Question
Please help with these as they are part of 1 question and I am so confused. I really need help like never before and I will highly consider thumbs up but please help asap.
1- There is no evidence that an ice storm that kills all earthworms struck the city of Guelph in Spring 2011. ( Choose true or false)
2- There is less food available for Earthworm Species A in Brown's Woods than in the Dairy Bush. ( Choose true or false)
3- Species A and Species B compete for the same critical resources. ( Choose true or false)
4- Species B limits the
Transcribed Image Text:In addition to assessing tree diversity in the woodlots, you decide to evaluate the
population abundance of two different earthworm species (A and B). The populations
of two species of earthworms has been recorded in a multi-year study in two of the
woodlots (Brown's Woods and Dairy Bush). The data from this study are shown
below.
Brown's Woods
Dairy Bush
Species
A
B
Year
Is the following statement consistent with the data presented in the graph, above?
Choose True for yes, the statement is consistent with the graph.
Choose False for no, the statement is not consistent with the graph.
Population Size
O 25 50 75 100 125 150 175 200 225
2008 ↑
600
2010
2011
2012
2013
2014
2015
2016
2017
2018
2019|
2020
2008
2009 ↑
2010
2011
2012
2013
2014
2015
2016
2017
2018
2019
2020
Expert Solution
This question has been solved!
Explore an expertly crafted, step-by-step solution for a thorough understanding of key concepts.

This is a popular solution!

Trending now
This is a popular solution!

Step by step
Solved in 2 steps

Knowledge Booster


Learn more about
Need a deep-dive on the concept behind this application? Look no further. Learn more about this topic, biology and related others by exploring similar questions and additional content below.Recommended textbooks for you