Please read the scenario attached and provide a step-by-step calculation for answers: iii) Calculate the value of your test Statistic iv) What is your conclusion for this test. Give a reason for your answer
Please read the scenario attached and provide a step-by-step calculation for answers: iii) Calculate the value of your test Statistic iv) What is your conclusion for this test. Give a reason for your answer

Glencoe Algebra 1, Student Edition, 9780079039897, 0079039898, 2018
18th Edition
ISBN:9780079039897
Author:Carter
Publisher:Carter
Chapter10: Statistics
Section: Chapter Questions
Problem 13PT

Related questions
Question
Please read the scenario attached and provide a step-by-step calculation for answers:
iii) Calculate the value of your test Statistic
iv) What is your conclusion for this test. Give a reason for your answer
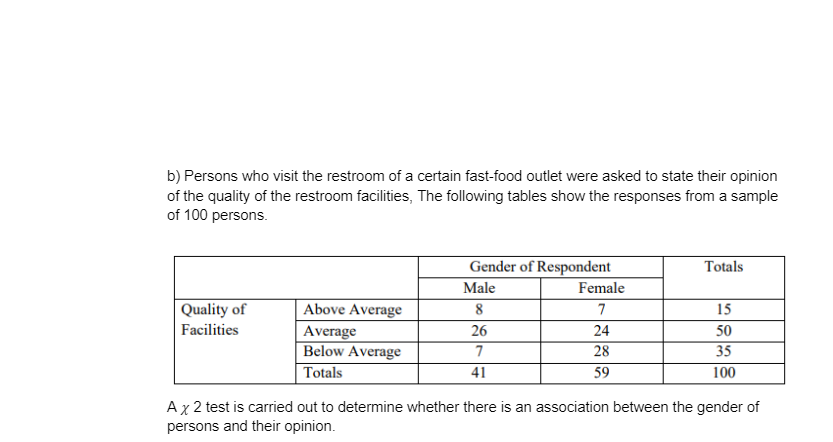
Transcribed Image Text:b) Persons who visit the restroom of a certain fast-food outlet were asked to state their opinion
of the quality of the restroom facilities, The following tables show the responses from a sample
of 100 persons.
Quality of
Facilities
Above Average
Average
Below Average
Totals
Gender of Respondent
Male
8
26
7
41
Female
7
24
28
59
Totals
15
50
35
100
A x 2 test is carried out to determine whether there is an association between the gender of
persons and their opinion.
Expert Solution
This question has been solved!
Explore an expertly crafted, step-by-step solution for a thorough understanding of key concepts.

Step by step
Solved in 3 steps with 1 images

Recommended textbooks for you
Glencoe Algebra 1, Student Edition, 9780079039897…
Algebra
ISBN:
9780079039897
Author:
Carter
Publisher:
McGraw Hill

College Algebra (MindTap Course List)
Algebra
ISBN:
9781305652231
Author:
R. David Gustafson, Jeff Hughes
Publisher:
Cengage Learning

Glencoe Algebra 1, Student Edition, 9780079039897…
Algebra
ISBN:
9780079039897
Author:
Carter
Publisher:
McGraw Hill
College Algebra (MindTap Course List)
Algebra
ISBN:
9781305652231
Author:
R. David Gustafson, Jeff Hughes
Publisher:
Cengage Learning